Answered step by step
Verified Expert Solution
Question
1 Approved Answer
need help with f-j A A A E 21 T AaBbccDc AaBbCcDAaBbc Aabbcc AaB AaBbccc AaBbce T Normal 1 No Spac... Heading 1 Heading 2
need help with f-j
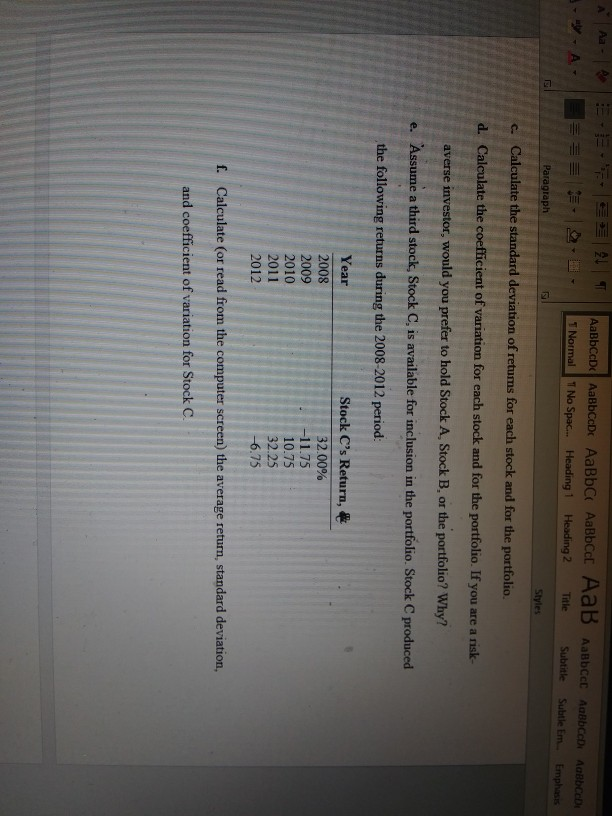
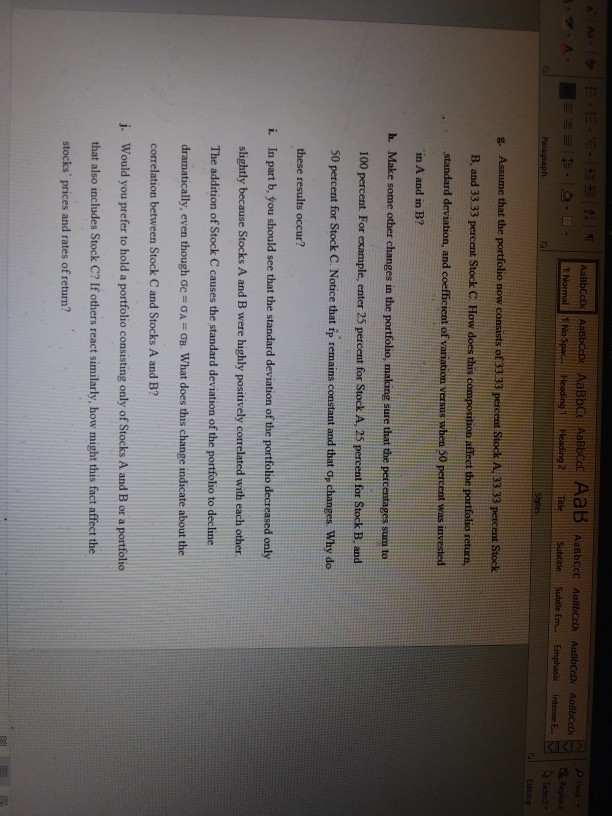
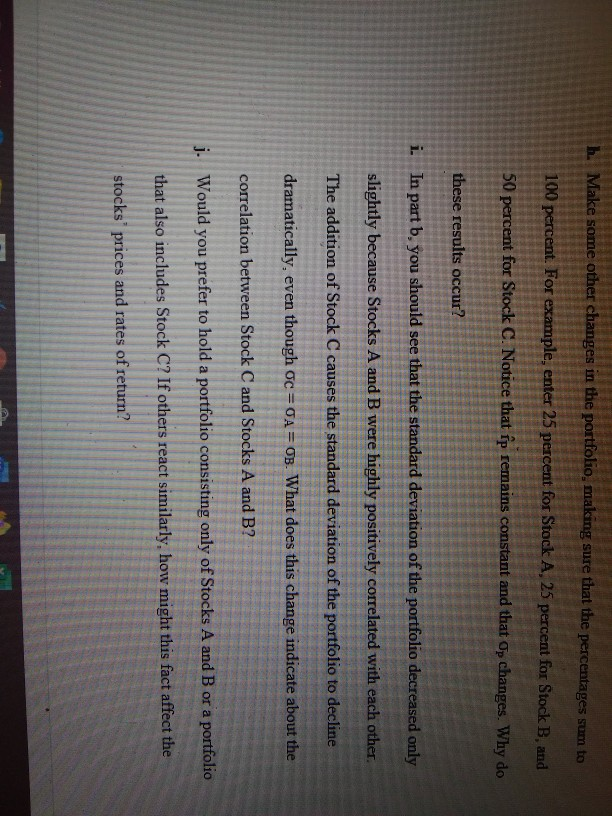
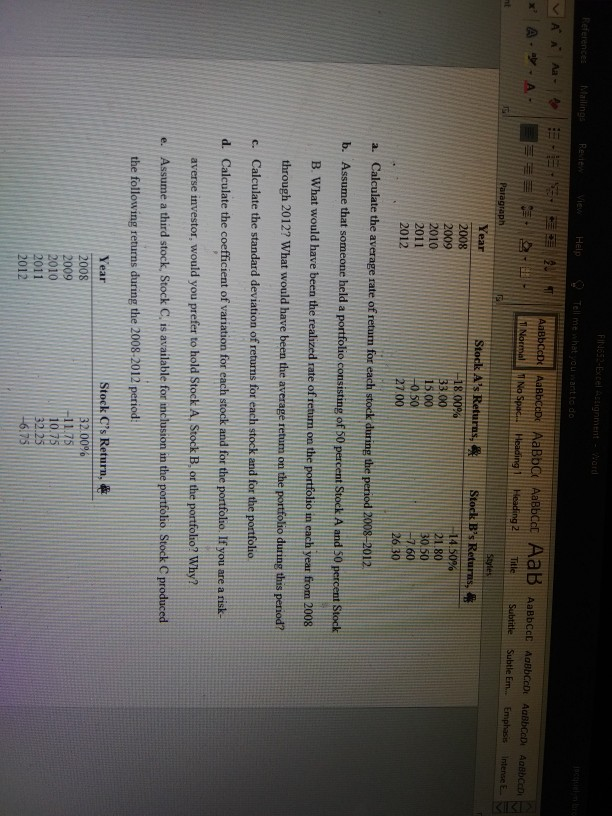
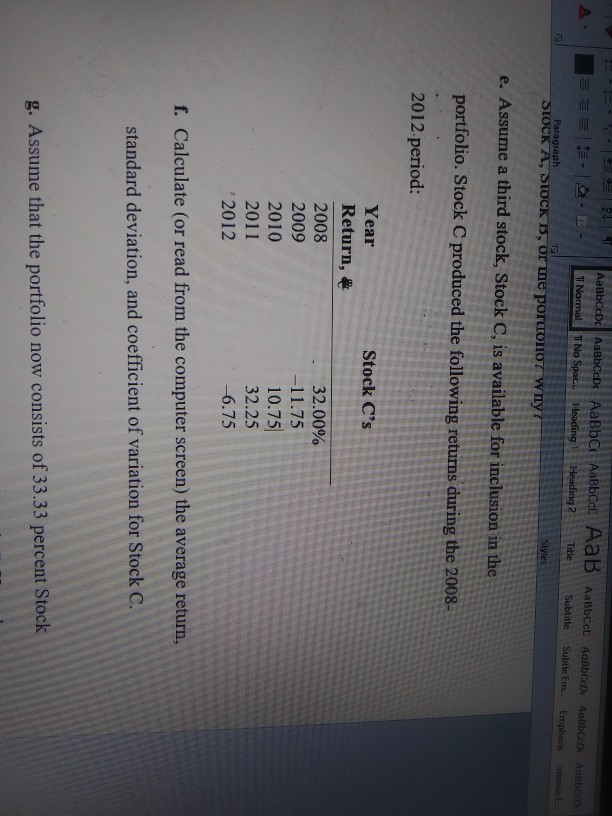
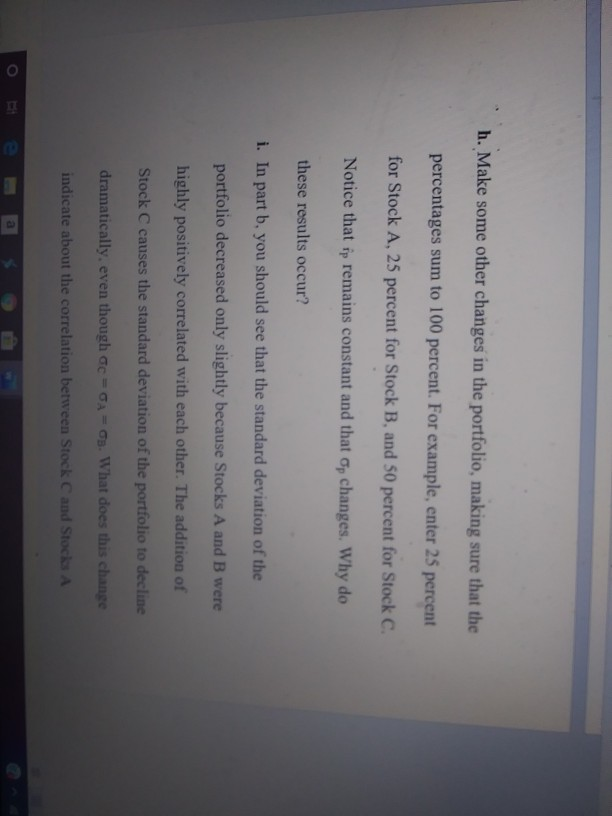
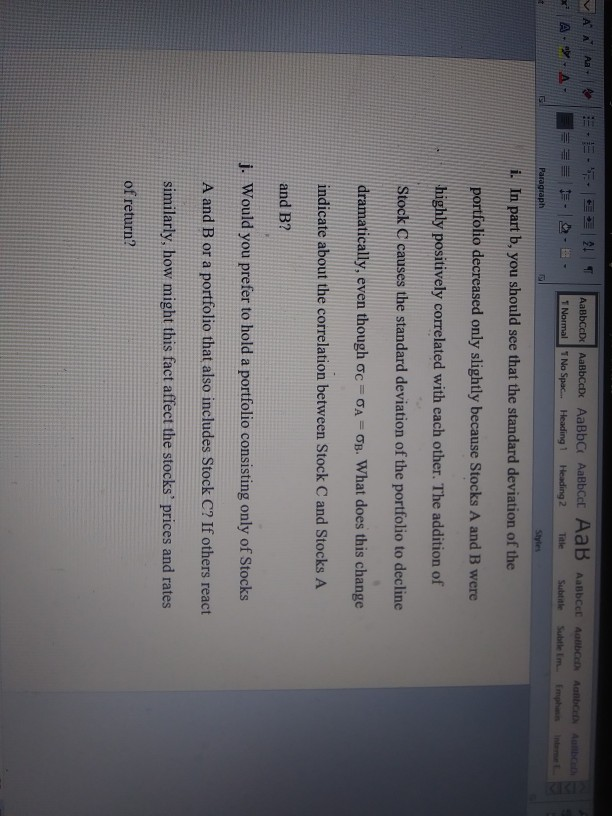
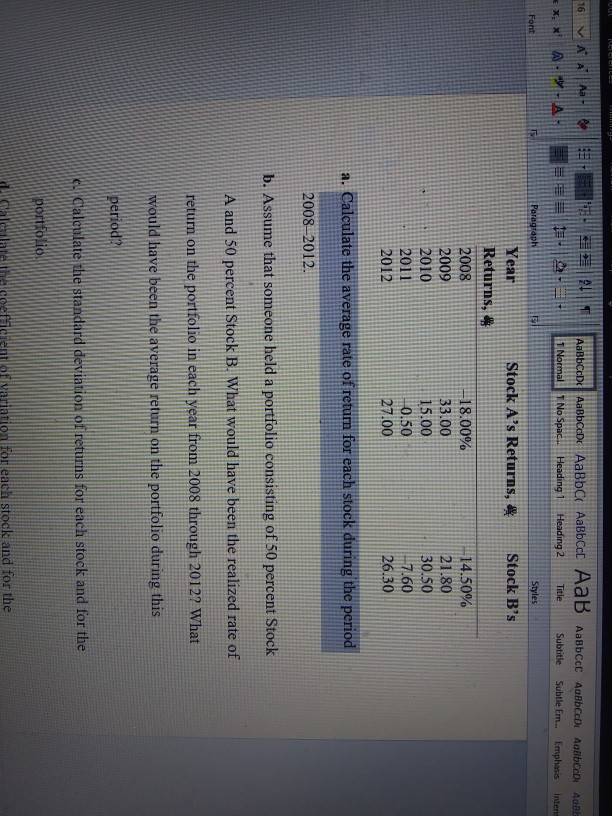
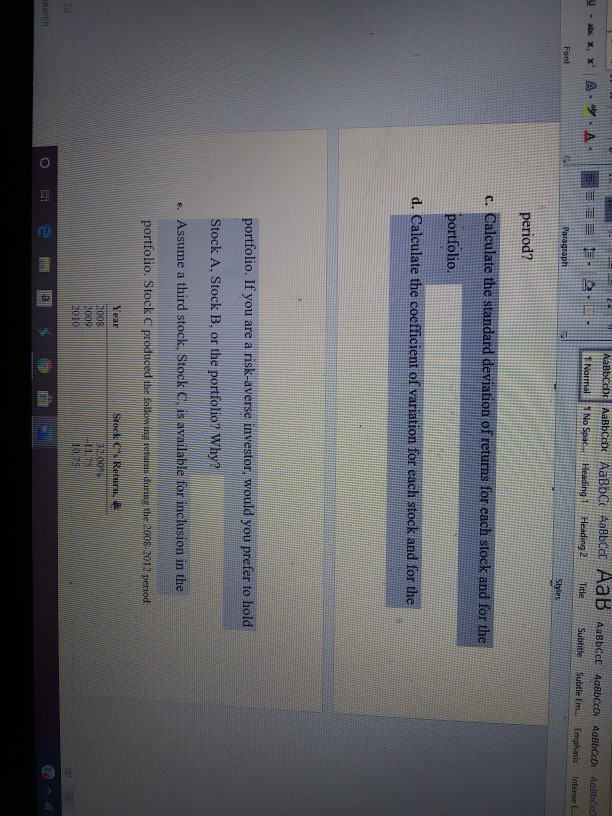
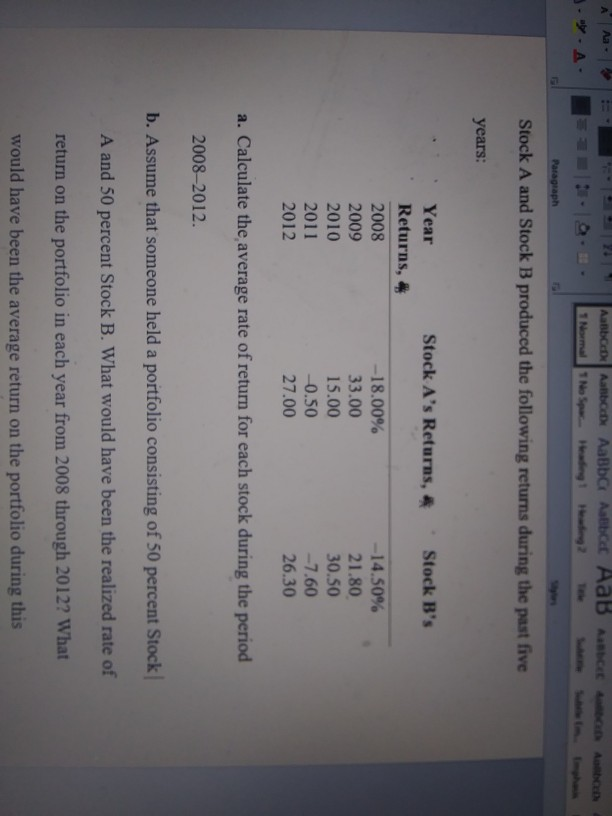
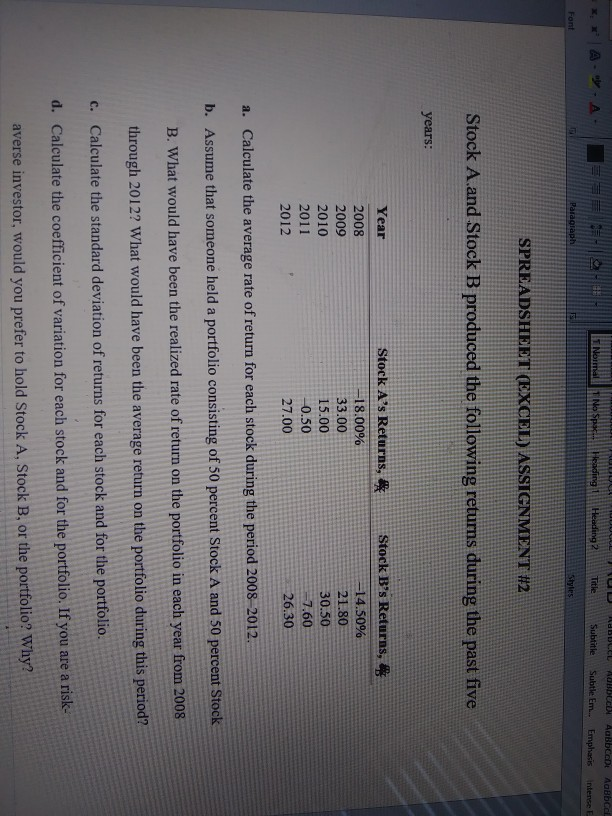
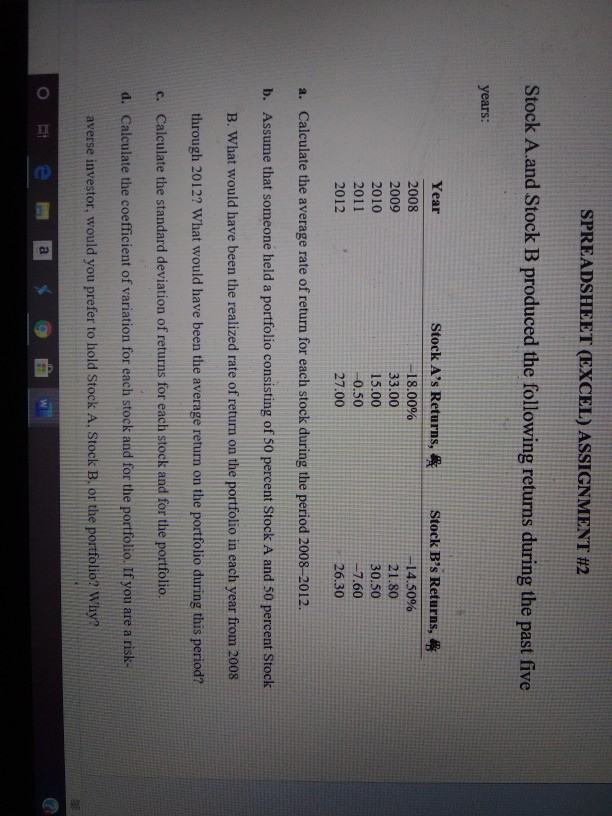
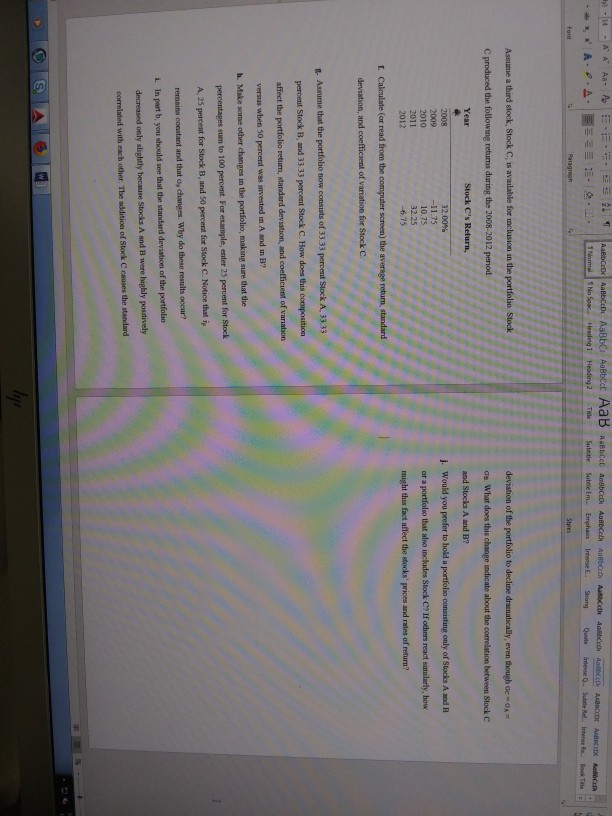
A A A E 21 T AaBbccDc AaBbCcDAaBbc Aabbcc AaB AaBbccc AaBbce T Normal 1 No Spac... Heading 1 Heading 2 Title Subtitle Subtle Em AaBbce Emphasis Paragraph Styles c. Calculate the standard deviation of retums for each stock and for the portfolio. d. Calculate the coefficient of variation for each stock and for the portfolio. If you are a risk- averse investor, would you prefer to hold Stock A, Stock B, or the portfolio? Why? e. Assume a third stock, Stock C, is available for inclusion in the portfolio Stock C produced the following returns during the 2008-2012 period: Year 2008 2009 2010 2011 2012 Stock C's Return, 32.00% -11.75 10.75 32.25 -6.75 f. Calculate (or read from the computer screen the average return, standard deviation, and coefficient of variation for Stock C. A = AaBbc Normal Aabbete AaBbc Aabbcc Aab AaBbce Mabad AaBbc ABCD No Spact Heading Heading 2 Title Subtitle|Subtle Em Emphasis intense E. Paragraph g. Assume that the portfolio now consists of 33 33 percent Stock A, 33 33 percent Stock B. and 3333 percent Stock C. How does this composition affect the portfolio return standard deviation, and coefficient of variation versus when 50 percent was invested in A and in B? h. Make some other changes in the portfolio, making sure that the percentages sum to 100 percent. For example, enter 25 percent for Stock A, 25 percent for Stock B, and 50 percent for Stock C. Notice that fp remains constant and that changes Why do these results occur? i. In part b, you should see that the standard deviation of the portfolio decreased only slightly because Stocks A and B were highly positively correlated with each other The addition of Stock C causes the standard deviation of the portfolio to decline dramatically, even though Oc=0A=0B. What does this change indicate about the correlation between Stock C and Stocks A and B? j. Would you prefer to hold a portfolio consisting only of Stocks A and B or a portfolio that also includes Stock C? If others react similarly, how might this fact affect the stocks prices and rates of return? h. Make some other changes in the portfolio, making sure that the percentages sum to 100 percent. For example, enter 25 percent for Stock A, 25 percent for Stock B, and 50 percent for Stock C. Notice that fp remains constant and that Op changes. Why do these results occur? i. In part b, you should see that the standard deviation of the portfolio decreased only slightly because Stocks A and B were highly positively correlated with each other, The addition of Stock C causes the standard deviation of the portfolio to decline dramatically, even though oc = OA= OB. What does this change indicate about the correlation between Stock C and Stocks A and B? j. Would you prefer to hold a portfolio consisting only of Stocks A and B or a portfolio that also includes Stock C? If others react similarly, how might this fact affect the stocks prices and rates of return? References Mailing Revies Vie H elp Tell me what you want to do VA * A. A - A AaBbce Normal AaBbceDc AaBb 1 No Spac.. Heading 1 AaBbcc AaB AaBbcc Aabbed Aabba Abbe Heading 2 Title Subtitle Subtle Em Emphasis intense E 2 . - Paragraph Year 2008 2009 2010 2011 2012 Stock A's Returas, 18.00% 33.00 15.00 10.50 Styles Stock B's Returns -14.50 21.80 30.50 -7.60 26 30 27.00 a. Calculate the average rate of return for each stock during the period 2008-2012 b. Assume that someone held a portfolio consisting of 50 percent Stock A and 50 percent Stock B. What would have been the realized rate of retum on the portfolio in each year from 2008 through 2012? What would have been the average retum on the portfolio during this period? Calculate the standard deviation of returns for each stock and for the portfolio d. Calculate the coefficient of variation for each stock and for the portfolio. If you are a risk- averse investor, would you prefer to hold Stock A. Stock B. or the portfolio? Why? e. Assume a third stock, Stock C is available for inclusion in the portfolio. Stock C produced the following returns during the 2008-2012 period: Year 2008 2009 2010 2011 2012 Stock C's Return, 32.00% -11.75 10.75 32.25 -6.75 AaBbCcDc AaBbCcDc AaBb T Normal 1 No Spac... Heading Paragraph STOCK A, STOCK B, or me porton107 why AaBbcA Heading 2 b Title AaBbcct AaBbceDe Aalbe Subtitle Subtle Em. Emphasis Rabben name Styles e. Assume a third stock, Stock C, is available for inclusion in the portfolio. Stock C produced the following returns during the 2008- 2012 period: Stock C's Year Return,& 2008 2009 2010 2011 2012 32.00% -11.75 10.75 32.25 -6.75 f. Calculate (or read from the computer screen) the average return, standard deviation, and coefficient of variation for Stock C. g. Assume that the portfolio now consists of 33.33 percent Stock h. Make some other changes in the portfolio, making sure that the percentages sum to 100 percent. For example, enter 25 percent for Stock A, 25 percent for Stock B, and 50 percent for Stock C. Notice that ip remains constant and that on changes. Why do these results occur? i. In part b, you should see that the standard deviation of the portfolio decreased only slightly because Stocks A and B were highly positively correlated with each other. The addition of Stock C causes the standard deviation of the portfolio to decline dramatically, even though oc= A=03. What does this change indicate about the correlation between Stock C and Stocks A lo a VAN A A. DK A 21 T === Paragraph AalbCD AalbCcDc AaBbc AaBbcc AaB AaBbce Alb 1 Normal T No Spac... Heading 1 Heading 2 Tale Subtitle Subtle Im Styles Alb A m ohan i. In part b, you should see that the standard deviation of the portfolio decreased only slightly because Stocks A and B were highly positively correlated with each other. The addition of Stock C causes the standard deviation of the portfolio to decline dramatically, even though c = A=05. What does this change indicate about the correlation between Stock C and Stocks A and B? j. Would you prefer to hold a portfolio consisting only of Stocks A and B or a portfolio that also includes Stock C? If others react similarly, how might this fact affect the stocks' prices and rates of return? bccDr AaBbcc ct AaD 1 Normal 1 No Spac. Heading 1 Heading 2 Title Subtitle Subtle Em... Emphasis inten Styles Stock B's Stock A's Returns, 16 VAA A NAL * *, * A. -AHE Font Paragraph Year Returns, # 2008 2009 2010 2011 2012 -18.00% 33.00 15.00 0.50 27.00 -14.50% 21.80 30.50 -7.60 26.30 a. Calculate the average rate of return for each stock during the period 20082012. b. Assume that someone held a portfolio consisting of 50 percent Stock A and 50 percent Stock B. What would have been the realized rate of return on the portfolio in each year from 2008 through 2012? What would have been the average return on the portfolio during this period? Calculate the standard deviation of returns for each stock and for the portfolio Calculate the coefficient of variation for each stock and for the ax * * A . A . 1Normal No Spa Heading Heading 2 Title Subtitle Subtle Em Emphasis = intense Font Styles period? c. Calculate the standard deviation of returns for each stock and for the portfolio d. Calculate the coefficient of variation for each stock and for the portfolio. If you are a risk-averse investor, would you prefer to hold Stock A, Stock B, or the portfolio? Why? e. Assume a third stock. Stock c. is available for inclusion in the portfolio. Stock produced the following rem m 2008/2012 period Stocks Return, Year 2008 2009 2010 20098 15 10.75 AaB Aanbod AaBb Abd Aab A D ABCD Paragraph Stock A and Stock B produced the following returns during the past five years: Stock A's Returns, Stock B's Year Returns, 2008 2009 2010 2011 2012 -18.00% 33.00 15.00 -0.50 27.00 -14.50% 21.80 30.50 -7.60 26.30 a. Calculate the average rate of return for each stock during the period 2008-2012 b. Assume that someone held a portfolio consisting of 50 percent Stock A and 50 percent Stock B. What would have been the realized rate of return on the portfolio in each year from 2008 through 2012? What would have been the average return on the portfolio during this *** AA S EH LLLL Heading till Heading No Spk CCL All ABCDi AaBbce Subtitle Subtle Em.. Emphasis intense E Title Font Paraglapi SPREADSHEET (EXCEL) ASSIGNMENT #2 Stock A and Stock B produced the following returns during the past five years: Stock A's Returns, & -18.00% Year 2008 2009 2010 2011 2012 33.00 Stock B's Returns, # -14.50% 21.80 30.50 7.60 26.30 15.00 -0.50 27.00 a. Calculate the average rate of return for each stock during the period 2008-2012 b. Assume that someone held a portfolio consisting of 50 percent Stock A and 50 percent Stock B. What would have been the realized rate of return on the portfolio in each year from 2008 through 2012? What would have been the average return on the portfolio during this period? c. Calculate the standard deviation of returns for each stock and for the portfolio. d. Calculate the coefficient of variation for each stock and for the portfolio. If you are a risk- averse investor, would you prefer to hold Stock A, Stock B, or the portfolio? Why? SPREADSHEET (EXCEL) ASSIGNMENT #2 Stock A.and Stock B produced the following returns during the past five years: Year 2008 2009 2010 2011 2012 Stock A's Returns, 18.00% 33.00 15.00 -0.50 27.00 Stock B's Returns, -14.50% 21.80 30.50 -7.60 26.30 a. Calculate the average rate of return for each stock during the period 2008-2012 b. Assume that someone held a portfolio consisting of 50 percent Stock A and 50 percent Stock B. What would have been the realized rate of return on the portfolio in each year from 2008 through 2012? What would have been the average return on the portfolio during this period? Calculate the standard deviation of returns for each stock and for the portfolio. d. Calculate the coefficient of variation for each stock and for the portfolio. If you are a risk averse investor, would you prefer to hold Stock A, Stock B, or the portfolio? Why M -NA A X .P.A. A athe ABCD Aabba Abcd ADD ABERCE MODEL ABB ABC ABC A N c Headegi Hewling Suteile Subdiem. Emphasie Strong EE . BC ABC.COM sse. S elbsterke Hotel Quote Paragraph Assume a third stock, Stock C, is available for inclusion in the portfolio Stock deviation of the portfolio to decline dramatically, even though c - OA= C produced the following returns during the 2008-2012 period. Os What does this change indicate about the correlation between Stock C Year Stock C's Return and Stocks A and B? 32.00% 2008 2009 2010 2011 10.75 j. Would you prefer to hold a portfolio consisting only of Stocks A and B or a portfolio that also includes Stock C? If others react similarly, how might this fact affect the stocks' prices and rates of retur? 2012 Calculate (or read from the computer screen the average retum, sta deviation, and coefficient of variation for Stock C. Assume that the portfolio now consists of 33 33 percent Stock A, 33.33 percent Stock Band 33.33 percent Stock C. How does this composition affect the portfolio retum, standard deviation, and coefficient of variation versus when 50 percent was invested in A and in ? h. Make some other changes in the portfolio, making sure that the percentages sum to 100 percent. For example, enter 25 percent for Stock A, 25 percent for Stock Band 50 percent for Stock C. Notice that ip remains constant and that a changes. Why do these results occur? 1. In part, you should see that the standard deviation of the portfolio decreased only sliphidly because Stocks A and B were highly poustively correlated with each other. The addition of Stock C auses the standard A A A E 21 T AaBbccDc AaBbCcDAaBbc Aabbcc AaB AaBbccc AaBbce T Normal 1 No Spac... Heading 1 Heading 2 Title Subtitle Subtle Em AaBbce Emphasis Paragraph Styles c. Calculate the standard deviation of retums for each stock and for the portfolio. d. Calculate the coefficient of variation for each stock and for the portfolio. If you are a risk- averse investor, would you prefer to hold Stock A, Stock B, or the portfolio? Why? e. Assume a third stock, Stock C, is available for inclusion in the portfolio Stock C produced the following returns during the 2008-2012 period: Year 2008 2009 2010 2011 2012 Stock C's Return, 32.00% -11.75 10.75 32.25 -6.75 f. Calculate (or read from the computer screen the average return, standard deviation, and coefficient of variation for Stock C. A = AaBbc Normal Aabbete AaBbc Aabbcc Aab AaBbce Mabad AaBbc ABCD No Spact Heading Heading 2 Title Subtitle|Subtle Em Emphasis intense E. Paragraph g. Assume that the portfolio now consists of 33 33 percent Stock A, 33 33 percent Stock B. and 3333 percent Stock C. How does this composition affect the portfolio return standard deviation, and coefficient of variation versus when 50 percent was invested in A and in B? h. Make some other changes in the portfolio, making sure that the percentages sum to 100 percent. For example, enter 25 percent for Stock A, 25 percent for Stock B, and 50 percent for Stock C. Notice that fp remains constant and that changes Why do these results occur? i. In part b, you should see that the standard deviation of the portfolio decreased only slightly because Stocks A and B were highly positively correlated with each other The addition of Stock C causes the standard deviation of the portfolio to decline dramatically, even though Oc=0A=0B. What does this change indicate about the correlation between Stock C and Stocks A and B? j. Would you prefer to hold a portfolio consisting only of Stocks A and B or a portfolio that also includes Stock C? If others react similarly, how might this fact affect the stocks prices and rates of return? h. Make some other changes in the portfolio, making sure that the percentages sum to 100 percent. For example, enter 25 percent for Stock A, 25 percent for Stock B, and 50 percent for Stock C. Notice that fp remains constant and that Op changes. Why do these results occur? i. In part b, you should see that the standard deviation of the portfolio decreased only slightly because Stocks A and B were highly positively correlated with each other, The addition of Stock C causes the standard deviation of the portfolio to decline dramatically, even though oc = OA= OB. What does this change indicate about the correlation between Stock C and Stocks A and B? j. Would you prefer to hold a portfolio consisting only of Stocks A and B or a portfolio that also includes Stock C? If others react similarly, how might this fact affect the stocks prices and rates of return? References Mailing Revies Vie H elp Tell me what you want to do VA * A. A - A AaBbce Normal AaBbceDc AaBb 1 No Spac.. Heading 1 AaBbcc AaB AaBbcc Aabbed Aabba Abbe Heading 2 Title Subtitle Subtle Em Emphasis intense E 2 . - Paragraph Year 2008 2009 2010 2011 2012 Stock A's Returas, 18.00% 33.00 15.00 10.50 Styles Stock B's Returns -14.50 21.80 30.50 -7.60 26 30 27.00 a. Calculate the average rate of return for each stock during the period 2008-2012 b. Assume that someone held a portfolio consisting of 50 percent Stock A and 50 percent Stock B. What would have been the realized rate of retum on the portfolio in each year from 2008 through 2012? What would have been the average retum on the portfolio during this period? Calculate the standard deviation of returns for each stock and for the portfolio d. Calculate the coefficient of variation for each stock and for the portfolio. If you are a risk- averse investor, would you prefer to hold Stock A. Stock B. or the portfolio? Why? e. Assume a third stock, Stock C is available for inclusion in the portfolio. Stock C produced the following returns during the 2008-2012 period: Year 2008 2009 2010 2011 2012 Stock C's Return, 32.00% -11.75 10.75 32.25 -6.75 AaBbCcDc AaBbCcDc AaBb T Normal 1 No Spac... Heading Paragraph STOCK A, STOCK B, or me porton107 why AaBbcA Heading 2 b Title AaBbcct AaBbceDe Aalbe Subtitle Subtle Em. Emphasis Rabben name Styles e. Assume a third stock, Stock C, is available for inclusion in the portfolio. Stock C produced the following returns during the 2008- 2012 period: Stock C's Year Return,& 2008 2009 2010 2011 2012 32.00% -11.75 10.75 32.25 -6.75 f. Calculate (or read from the computer screen) the average return, standard deviation, and coefficient of variation for Stock C. g. Assume that the portfolio now consists of 33.33 percent Stock h. Make some other changes in the portfolio, making sure that the percentages sum to 100 percent. For example, enter 25 percent for Stock A, 25 percent for Stock B, and 50 percent for Stock C. Notice that ip remains constant and that on changes. Why do these results occur? i. In part b, you should see that the standard deviation of the portfolio decreased only slightly because Stocks A and B were highly positively correlated with each other. The addition of Stock C causes the standard deviation of the portfolio to decline dramatically, even though oc= A=03. What does this change indicate about the correlation between Stock C and Stocks A lo a VAN A A. DK A 21 T === Paragraph AalbCD AalbCcDc AaBbc AaBbcc AaB AaBbce Alb 1 Normal T No Spac... Heading 1 Heading 2 Tale Subtitle Subtle Im Styles Alb A m ohan i. In part b, you should see that the standard deviation of the portfolio decreased only slightly because Stocks A and B were highly positively correlated with each other. The addition of Stock C causes the standard deviation of the portfolio to decline dramatically, even though c = A=05. What does this change indicate about the correlation between Stock C and Stocks A and B? j. Would you prefer to hold a portfolio consisting only of Stocks A and B or a portfolio that also includes Stock C? If others react similarly, how might this fact affect the stocks' prices and rates of return? bccDr AaBbcc ct AaD 1 Normal 1 No Spac. Heading 1 Heading 2 Title Subtitle Subtle Em... Emphasis inten Styles Stock B's Stock A's Returns, 16 VAA A NAL * *, * A. -AHE Font Paragraph Year Returns, # 2008 2009 2010 2011 2012 -18.00% 33.00 15.00 0.50 27.00 -14.50% 21.80 30.50 -7.60 26.30 a. Calculate the average rate of return for each stock during the period 20082012. b. Assume that someone held a portfolio consisting of 50 percent Stock A and 50 percent Stock B. What would have been the realized rate of return on the portfolio in each year from 2008 through 2012? What would have been the average return on the portfolio during this period? Calculate the standard deviation of returns for each stock and for the portfolio Calculate the coefficient of variation for each stock and for the ax * * A . A . 1Normal No Spa Heading Heading 2 Title Subtitle Subtle Em Emphasis = intense Font Styles period? c. Calculate the standard deviation of returns for each stock and for the portfolio d. Calculate the coefficient of variation for each stock and for the portfolio. If you are a risk-averse investor, would you prefer to hold Stock A, Stock B, or the portfolio? Why? e. Assume a third stock. Stock c. is available for inclusion in the portfolio. Stock produced the following rem m 2008/2012 period Stocks Return, Year 2008 2009 2010 20098 15 10.75 AaB Aanbod AaBb Abd Aab A D ABCD Paragraph Stock A and Stock B produced the following returns during the past five years: Stock A's Returns, Stock B's Year Returns, 2008 2009 2010 2011 2012 -18.00% 33.00 15.00 -0.50 27.00 -14.50% 21.80 30.50 -7.60 26.30 a. Calculate the average rate of return for each stock during the period 2008-2012 b. Assume that someone held a portfolio consisting of 50 percent Stock A and 50 percent Stock B. What would have been the realized rate of return on the portfolio in each year from 2008 through 2012? What would have been the average return on the portfolio during this *** AA S EH LLLL Heading till Heading No Spk CCL All ABCDi AaBbce Subtitle Subtle Em.. Emphasis intense E Title Font Paraglapi SPREADSHEET (EXCEL) ASSIGNMENT #2 Stock A and Stock B produced the following returns during the past five years: Stock A's Returns, & -18.00% Year 2008 2009 2010 2011 2012 33.00 Stock B's Returns, # -14.50% 21.80 30.50 7.60 26.30 15.00 -0.50 27.00 a. Calculate the average rate of return for each stock during the period 2008-2012 b. Assume that someone held a portfolio consisting of 50 percent Stock A and 50 percent Stock B. What would have been the realized rate of return on the portfolio in each year from 2008 through 2012? What would have been the average return on the portfolio during this period? c. Calculate the standard deviation of returns for each stock and for the portfolio. d. Calculate the coefficient of variation for each stock and for the portfolio. If you are a risk- averse investor, would you prefer to hold Stock A, Stock B, or the portfolio? Why? SPREADSHEET (EXCEL) ASSIGNMENT #2 Stock A.and Stock B produced the following returns during the past five years: Year 2008 2009 2010 2011 2012 Stock A's Returns, 18.00% 33.00 15.00 -0.50 27.00 Stock B's Returns, -14.50% 21.80 30.50 -7.60 26.30 a. Calculate the average rate of return for each stock during the period 2008-2012 b. Assume that someone held a portfolio consisting of 50 percent Stock A and 50 percent Stock B. What would have been the realized rate of return on the portfolio in each year from 2008 through 2012? What would have been the average return on the portfolio during this period? Calculate the standard deviation of returns for each stock and for the portfolio. d. Calculate the coefficient of variation for each stock and for the portfolio. If you are a risk averse investor, would you prefer to hold Stock A, Stock B, or the portfolio? Why M -NA A X .P.A. A athe ABCD Aabba Abcd ADD ABERCE MODEL ABB ABC ABC A N c Headegi Hewling Suteile Subdiem. Emphasie Strong EE . BC ABC.COM sse. S elbsterke Hotel Quote Paragraph Assume a third stock, Stock C, is available for inclusion in the portfolio Stock deviation of the portfolio to decline dramatically, even though c - OA= C produced the following returns during the 2008-2012 period. Os What does this change indicate about the correlation between Stock C Year Stock C's Return and Stocks A and B? 32.00% 2008 2009 2010 2011 10.75 j. Would you prefer to hold a portfolio consisting only of Stocks A and B or a portfolio that also includes Stock C? If others react similarly, how might this fact affect the stocks' prices and rates of retur? 2012 Calculate (or read from the computer screen the average retum, sta deviation, and coefficient of variation for Stock C. Assume that the portfolio now consists of 33 33 percent Stock A, 33.33 percent Stock Band 33.33 percent Stock C. How does this composition affect the portfolio retum, standard deviation, and coefficient of variation versus when 50 percent was invested in A and in ? h. Make some other changes in the portfolio, making sure that the percentages sum to 100 percent. For example, enter 25 percent for Stock A, 25 percent for Stock Band 50 percent for Stock C. Notice that ip remains constant and that a changes. Why do these results occur? 1. In part, you should see that the standard deviation of the portfolio decreased only sliphidly because Stocks A and B were highly poustively correlated with each other. The addition of Stock C auses the standard
Step by Step Solution
There are 3 Steps involved in it
Step: 1

Get Instant Access to Expert-Tailored Solutions
See step-by-step solutions with expert insights and AI powered tools for academic success
Step: 2

Step: 3

Ace Your Homework with AI
Get the answers you need in no time with our AI-driven, step-by-step assistance
Get Started


