Answered step by step
Verified Expert Solution
Link Copied!

Question

1 Approved Answer

Need help with H-R diagram in Python I was given the data as described below. I believe I have the first diagram that is required

Need help with H-R diagram in Python

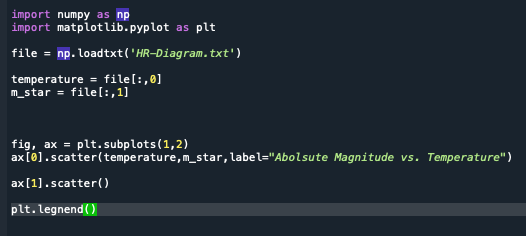
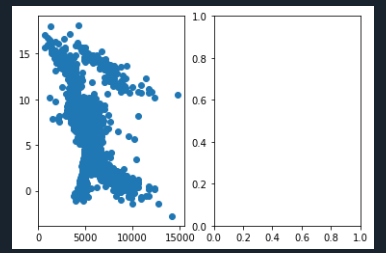
I was given the data as described below. I believe I have the first diagram that is required for the left, the absolute magnitude vs. temperature graph, but I am not sure how to input the equation to get the second part.

Any help is appreciated!
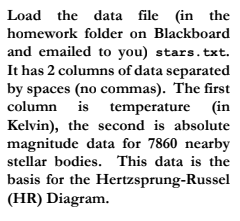
image text in transcribedimage text in transcribedimage text in transcribedimage text in transcribed

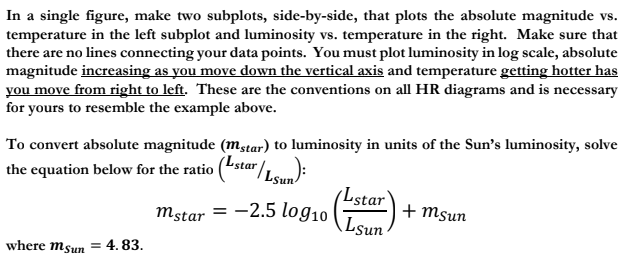
Load the data file (in the homework folder on Blackboard and emailed to you) stars.txt. It has 2 columns of data separated by spaces (no commas). The first column is temperature (in Kelvin), the second is absolute magnitude data for 7860 nearby stellar bodies. This data is the basis for the Hertzsprung-Russel (HR) Diagram. In a single figure, make two subplots, side-by-side, that plots the absolute magnitude vs. temperature in the left subplot and luminosity vs. temperature in the right. Make sure that there are no lines connecting your data points. You must plot luminosity in log scale, absolute magnitude increasing as you move down the vertical axis and temperature getting hotter has you move from right to left. These are the conventions on all HR diagrams and is necessary for yours to resemble the example above. To convert absolute magnitude (mstar) to luminosity in units of the Sun's luminosity, solve the equation below for the ratio ("star / Lsun): mstar = -2.5 log10 +msun (Lstar) Lsun where mun = 4.83. import numpy as np import matplotlib.pyplot as plt file = np.loadtxt('HR-Diagram.txt') temperature = file(:,&] m_star = file(:,1) fig, ax = plt.subplots(1,2) ax[6) .scatter(temperature, n_star, label="Abolsute Magnitude vs. Temperature") ax[1].scatter() plt. legnend() 10 15 0.8 10 0.6 04 5 0.2 0 0 5000 0.0 15000 0.0 10000 02 04 06 0.8 10

Step by Step Solution

There are 3 Steps involved in it

Step: 1

blur-text-image

Get Instant Access to Expert-Tailored Solutions

See step-by-step solutions with expert insights and AI powered tools for academic success

Step: 2

blur-text-image_2

Step: 3

blur-text-image_3

Ace Your Homework with AI

Get the answers you need in no time with our AI-driven, step-by-step assistance

Get Started

Recommended Textbook for

Excel As Your Database

Authors: Paul Cornell

1st Edition

1590597516, 978-1590597514

More Books

Students also viewed these Databases questions