

Answered step by step
Verified Expert Solution
Question
1 Approved Answer
Need help with Linear Algebra problem 3) Mr. X is working with a local doctor on a Big Data project to determine whether someone is
Need help with Linear Algebra problem
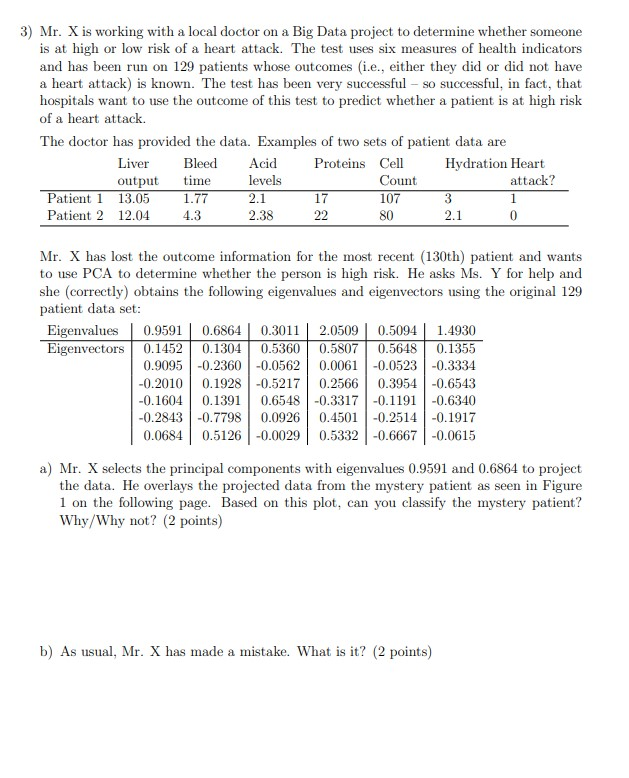
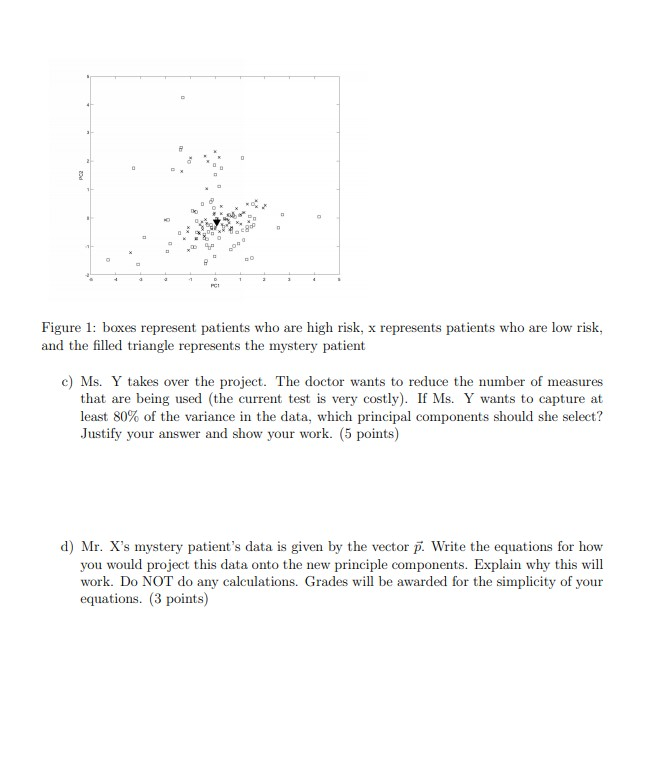
3) Mr. X is working with a local doctor on a Big Data project to determine whether someone is at high or low risk of a heart attack. The test uses six measures of health indicators and has been run on 129 patients whose outcomes i.e., either they did or did not have a heart attack) is known. The test has been very successful - so successful, in fact, that hospitals want to use the outcome of this test to predict whether a patient is at high risk of a heart attack. The doctor has provided the data. Examples of two sets of patient data are Liver Bleed Acid Proteins Cell Hydration Heart output time levels Count attack? Patient 1 13.05 1.77 2.1 17 107 31 Patient 2 12.04 4.3 2.38 22 80 2.1 0 Mr. X has lost the outcome information for the most recent (130th) patient and wants to use PCA to determine whether the person is high risk. He asks Ms. Y for help and she correctly) obtains the following eigenvalues and eigenvectors using the original 129 patient data set: Eigenvalues 0.9591 0.6864 0.3011 | 2.0509 0.5094 1.4930 Eigenvectors 0.1452 0.1304 0.5360 0.5807 0.5648 0.1355 0.9095 -0.2360 -0.0562 0.0061 -0.0523 -0.3334 -0.2010 0.1928 -0.5217 0.2566 0.3954 -0.6543 -0.1604 0.1391 0.6548 -0.3317 -0.1191 -0.6340 -0.2843 -0.7798 0.0926 0.4501 -0.2514 -0.1917 0.0684 0.5126 -0.0029 0.5332 -0.6667 -0.0615 a) Mr. X selects the principal components with eigenvalues 0.9591 and 0.6864 to project the data. He overlays the projected data from the mystery patient as seen in Figure 1 on the following page. Based on this plot, can you classify the mystery patient? Why/Why not? (2 points) b) As usual, Mr. X has made a mistake. What is it? (2 points) Figure 1: boxes represent patients who are high risk, x represents patients who are low risk, and the filled triangle represents the mystery patient c) Ms. Y takes over the project. The doctor wants to reduce the number of measures that are being used (the current test is very costly). If Ms. Y wants to capture at least 80% of the variance in the data, which principal components should she select? Justify your answer and show your work. (5 points) d) Mr. X's mystery patient's data is given by the vector p. Write the equations for how you would project this data onto the new principle components. Explain why this will work. Do NOT do any calculations. Grades will be awarded for the simplicity of your equations. (3 points) 3) Mr. X is working with a local doctor on a Big Data project to determine whether someone is at high or low risk of a heart attack. The test uses six measures of health indicators and has been run on 129 patients whose outcomes i.e., either they did or did not have a heart attack) is known. The test has been very successful - so successful, in fact, that hospitals want to use the outcome of this test to predict whether a patient is at high risk of a heart attack. The doctor has provided the data. Examples of two sets of patient data are Liver Bleed Acid Proteins Cell Hydration Heart output time levels Count attack? Patient 1 13.05 1.77 2.1 17 107 31 Patient 2 12.04 4.3 2.38 22 80 2.1 0 Mr. X has lost the outcome information for the most recent (130th) patient and wants to use PCA to determine whether the person is high risk. He asks Ms. Y for help and she correctly) obtains the following eigenvalues and eigenvectors using the original 129 patient data set: Eigenvalues 0.9591 0.6864 0.3011 | 2.0509 0.5094 1.4930 Eigenvectors 0.1452 0.1304 0.5360 0.5807 0.5648 0.1355 0.9095 -0.2360 -0.0562 0.0061 -0.0523 -0.3334 -0.2010 0.1928 -0.5217 0.2566 0.3954 -0.6543 -0.1604 0.1391 0.6548 -0.3317 -0.1191 -0.6340 -0.2843 -0.7798 0.0926 0.4501 -0.2514 -0.1917 0.0684 0.5126 -0.0029 0.5332 -0.6667 -0.0615 a) Mr. X selects the principal components with eigenvalues 0.9591 and 0.6864 to project the data. He overlays the projected data from the mystery patient as seen in Figure 1 on the following page. Based on this plot, can you classify the mystery patient? Why/Why not? (2 points) b) As usual, Mr. X has made a mistake. What is it? (2 points) Figure 1: boxes represent patients who are high risk, x represents patients who are low risk, and the filled triangle represents the mystery patient c) Ms. Y takes over the project. The doctor wants to reduce the number of measures that are being used (the current test is very costly). If Ms. Y wants to capture at least 80% of the variance in the data, which principal components should she select? Justify your answer and show your work. (5 points) d) Mr. X's mystery patient's data is given by the vector p. Write the equations for how you would project this data onto the new principle components. Explain why this will work. Do NOT do any calculations. Grades will be awarded for the simplicity of your equations. (3 points)Step by Step Solution
There are 3 Steps involved in it
Step: 1

Get Instant Access to Expert-Tailored Solutions
See step-by-step solutions with expert insights and AI powered tools for academic success
Step: 2

Step: 3
Ace Your Homework with AI
Get the answers you need in no time with our AI-driven, step-by-step assistance
Get Started
Financial accounting
Authors: Walter T. Harrison Jr., Charles T. Horngren, C. William Thom
9th edition
978-0132751216, 132751127, 132751216, 978-0132751124