Need help with math lab. Thank you very much I appreciate all the help.
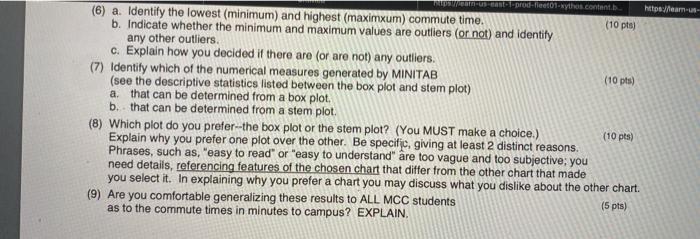
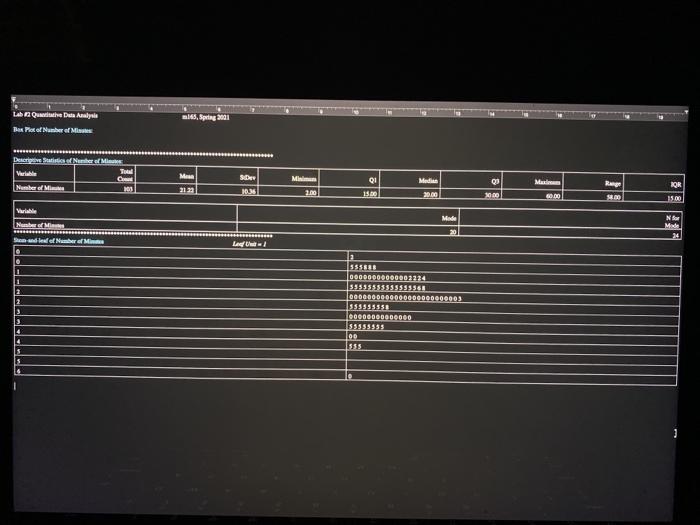
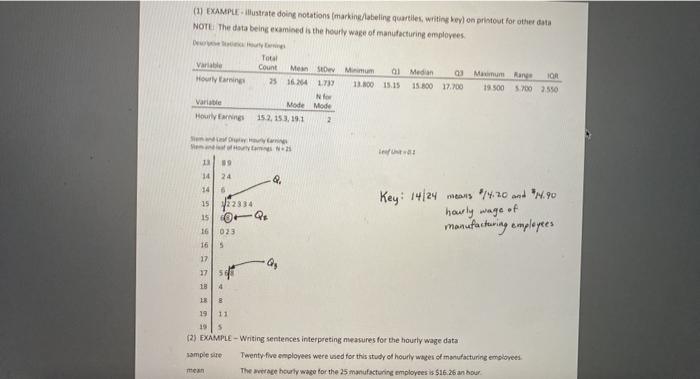
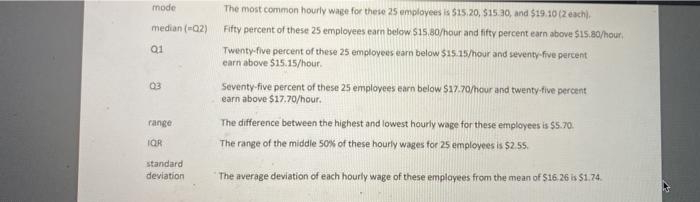
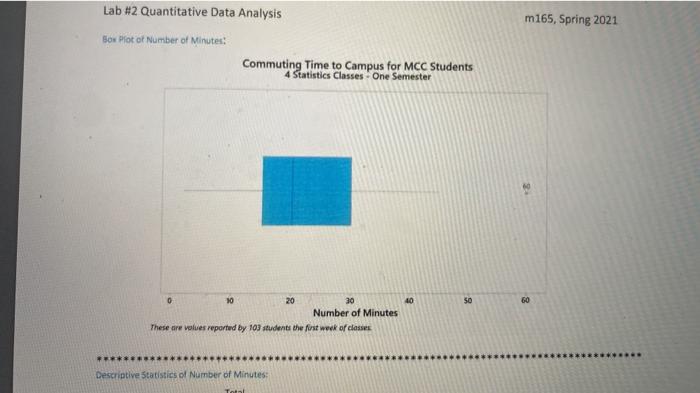
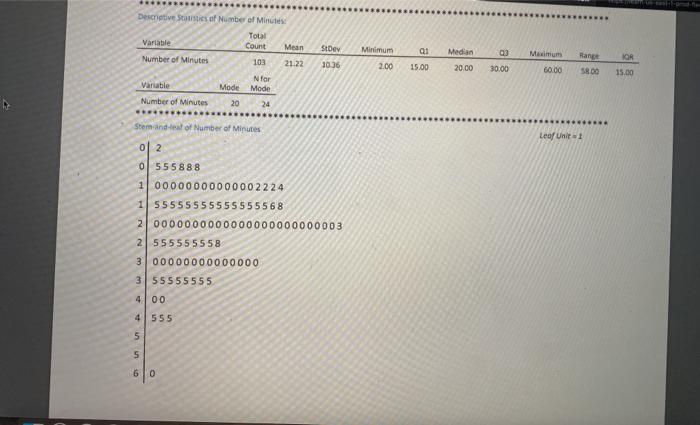
Presentation and grammar (you will lose points if PART B is not typed, double-spaced) Total of 20 pts PART A - Notations to make on the MINITAB printout. Total of 20 pts Take a picture of your notated stem plot and insert to your word file. See page two of this packet that illustrates with another data set writing of a key (task 1 below) AND marking/labeling quartiles (task 2 below) on a stem plot (1) Write a proper key for the stem plot. The key must include units/abels and (10 pts) demonstrate how to read two data values using one stem (2) Physically mark and label the quartiles on the stem plot in the leaves portion of the plots. (10 pts) (If a quartile falls on a value, circle the leat; if a quartile falls between values, draw a line between leaves.) Total of 85 pts PART B - This portion of the lab is to be typed, double-spaced. Read through "Additional Comments - LAB #2 - PART 3" (third page of this packet). discussing logistics of the assignment and providing guidance on answering questions. (3) Determine the skewness of the data set and explain how you determined the skew (10 pts by discussing two different ways (in detail) referencing numbers as appropriate (30 pts (4) Using sentences (9 total sentences), write interpretations (not definitions) of this data about the campus commute times by students at MCC for each of the following values. Use as a guide the examples completed in lecture materials, examples provided as extra practice on Blackboard, and examples on the second page of this lab packet for another set of data. Each sentence needs to reference this data set as commute times to campus by students at MCC. i IQR iv. Q: vii. range i mean v. Q. (median) vill sample size ili mode vi. O ix, standard deviation (5) For this data on commute times to campus (10 pts) a. Identify the numerical values that are measures of center b. Identify the numerical values that are measures of relative position c. Identify the numerical values that are measures of variability, (NOTE - Be sure to include the values with units for this data on commute times to campus.) (10 pts) (6) a. Identify the lowest (minimum) and highest (maximxum) commute time. b. Indicate whether the minimum and maximum values are outliers (or not) and identity a. Tant-prod-feet01ythos content. https://eam - (6) a. Identify the lowest (minimum) and highest (maximxum) commute time. (10 pts) b. Indicate whether the minimum and maximum values are outliers (or not) and identify any other outliers. c. Explain how you decided if there are (or are not) any outliers. (7) Identify which of the numerical measures generated by MINITAB (10 pts) (see the descriptive statistics listed between the box plot and stem plot) that can be determined from a box plot. b. that can be determined from a stem plot. (8) Which plot do you prefer--the box plot or the stem plot? (You MUST make a choice.) (10 pts) Explain why you prefer one plot over the other. Be specific, giving at least 2 distinct reasons. Phrases, such as, "easy to read" or "easy to understand" are too vague and too subjective; you need details, referencing features of the chosen chart that differ from the other chart that made you select it. In explaining why you prefer a chart you may discuss what you dislike about the other chart. (9) Are you comfortable generalizing these results to ALL MCC students (5 pts) as to the commute times in minutes to campus? EXPLAIN. ml, Sping 2001 Lab Que Data Analysis Ben Mek of Number of Mi Detergene Number of Minu To Men M QI 02 Sibe 10:36 Maxim R BOR Number of Mim 2.00 15.00 10.00 0.00 35.00 We Mode Nube NS ME Sweef Number of lo La 1 12 2 555533 QOOOOOOOOO0002224 55555555555555561 0000000000000000000000003 5559991 00000000000000 55555555 100 555 4 (1) EXAMPLE, Hustrate doing notations arkinetbeling quarties, writing baylon printout for other data NOTE The data being camined is the hourly ware of manufacturing employees Variable Hourlying Total Count Mewn SD Mimum 25 1624 1730 11.00 15.15 Nor Mode Mode 152, 153, 191 2 Median 15.300 17.700 Maximum Range OR 19.500 5.700 2550 Variable Hourly Earning NE Q. 39 14 24 14 6 15 22334 15 023 Q Key: 14/24 mars 74.20 und 9.90 hourly wage of manufacturing employees 5 16 17 17 18 4 18 B 19 11 19 5 (2) EXAMPLE - Writing sentences interpreting measures for the hourly wage data samplesie Twenty five employees were used for this study of hourly wages of manufacturing employees mean The wee hourly wage for the 25mmufacturing employees is $16 26 an hour mode median (-02) Q1 03 The most common hourly wage for these 25 employees is $15.20, $15.30, and $19.10(2 each), Fifty percent of these 25 employees earn below 515.80/hour and fifty percent earn above $15.80/hout, Twenty-five percent of these 25 employees war below $15.15/hour and seventy-five percent earn above $15.15/hour Seventy-five percent of these 25 employees earn below $17.70/hour and twenty-five percent earn above $17.70/hour. The difference between the highest and lowest hourly wage for these employees is $5.70. The range of the middle 50% of these hourly wages for 25 employees is $2.55 range IOR standard deviation The average deviation of each hourly wage of these employees from the mean of $16.26 is $1.74. Additional Comments - LAB #2 - PART B m165, Spring 2001 The data you are analyzing was generated at the start of a recent semester when 103 students in statisties classes responded to the question "What is the commuting time in MINUTES from your home to MCC" In answering questions for this tab you will need to look at notes and class materials pertaining to stem plots, box plots, numerical measures, skewness, samples, and populations The analysis is to be written using sentences and must be fyped double spaced. Throughout the analysis be sure to reference the data in commute times in minutes) by MCC students and reference numbers whenever possible. Each answer should be grouped with the problem number being answered. Do not Include the question with your answers: You should incorporate the question besked, that is your answers need to stand alone without the question Question THREE Determine whether the data set is left, right, or no skew. In addition to determining the skewness, explain how you made the skewness decision, using two different methods Question FOUR Write a sentence for each numerical measure that interprets the measure's meaning in regards to commuting time to campus for this sample of MCC students. Refer to class notes, examples provided in class and with the lab), and a document posted on Blackboard in the lab 12 folder about writing Interpretation sentences. Question FIVE Classify the numerical measures (not sample size) interpreted in question four by the characteristic the measure describes - center, relative position, and/or variability. Be sure to include the characteristic and necessary label/units. Question SIX In addition to identifying the minimum and maximum commute times, decide if any of these values are outliers, Identify the values of any other outllers, and explain how you decided if outliers are present. You need to indicate if there are or are not any outliers. If there are outliers you need to identify the values and explain how you decided the values are outlers. Question SEVEN Your goal in answering question seven is to identify the measures (see values generated by MINITAB listed under descriptive statistics between the box plot and stem plot) that would be possible to determine working with a box plot (part a) and from working with a stem plot (part bl Question FIGHT Make a choice, box plot or stem plot, as your preferred plot for this data commute times to campus of MCC students and give reasons for your choice. Question NINE Clearly indicate yes or no about using your observations for this sample to make conclusions about the commute times to campus of all students at MCC. To assist you in your decision, review class materials about the criteria for a sample to be considered "representative" Lab 22. Serve 2022. LI m165, Spring 2021 Lab #2 Quantitative Data Analysis Bow Plot of Number of Minutes: Commuting Time to Campus for MCC Students 4 Statistics Classes One Semester 40 50 60 0 30 20 30 Number of Minutes These are values reported by 103 students the first week of classes **** Descriptive Statistics of Number of Minutes: Descriptive States of Number of Minutes Tots Variable Count Mean Number of Minutes 103 21.22 Minimum 0.1 Stev 10:36 Maximum Median 20.00 Range IOR 2.00 15.00 03 30,00 50.00 15.00 Nfor Variable Mode Mode Number of Minutes 20 24 Stem-and-teal of Number of Minutes Leaf Unit 1 02 0555888 1 00000000000002224 155555555555555568 2 0000000000000000000000003 2 555555558 3 00000000000000 355555555 400 4 555 5 5 60