

Answered step by step
Verified Expert Solution
Question
1 Approved Answer
need help with project questions Other non-operating income (expense) net 2021- $373 2020- $2,039 2019- $2,156 Interest income, net 2021- $1,380 2020- $435 2019- $8,302
need help with project questions 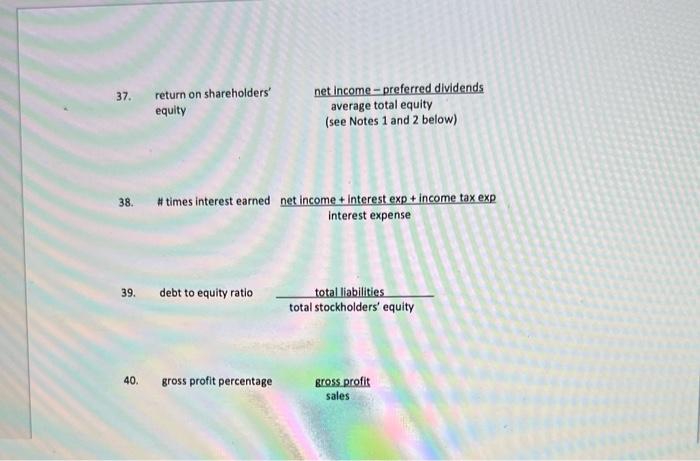
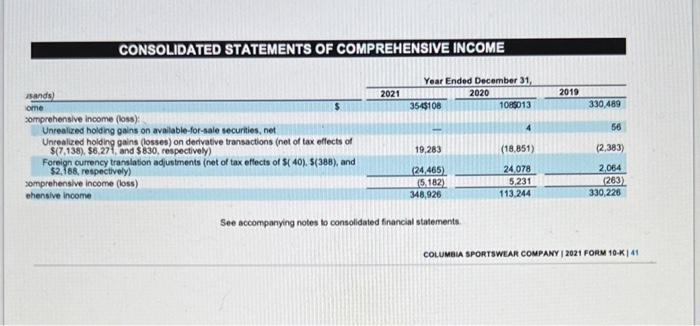
Other non-operating income (expense) net 2021- $373 2020- $2,039 2019- $2,156
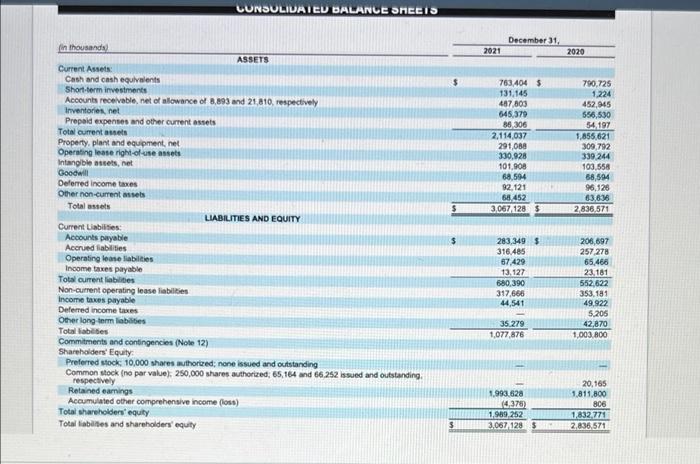
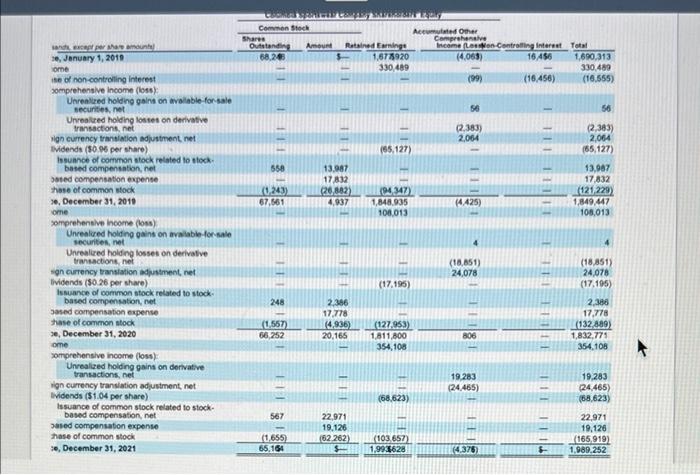
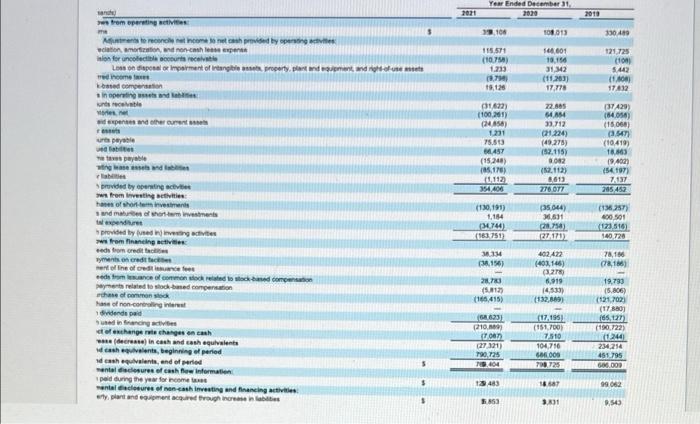
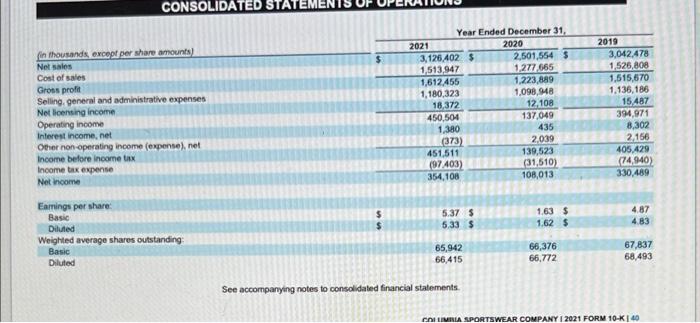
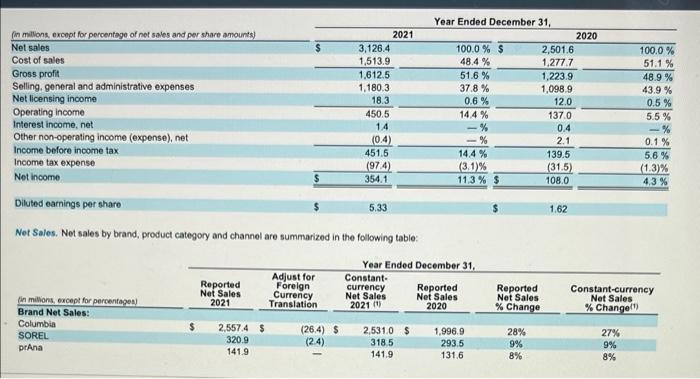
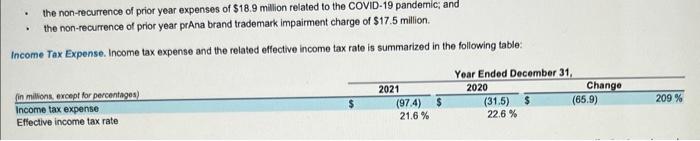
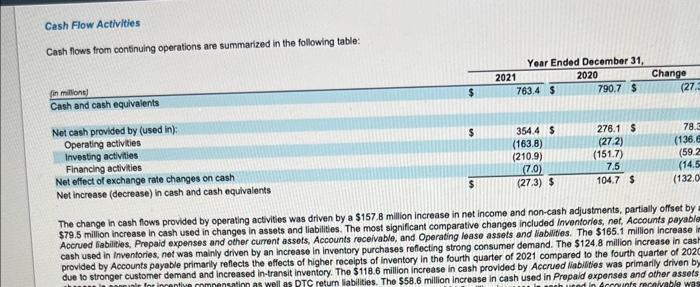
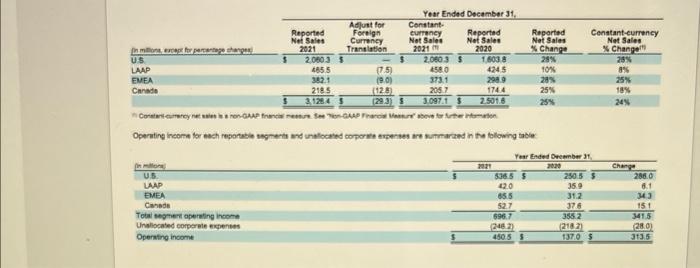
37. return on shareholders' equity 38. #times interest earned net income + interest exp+ income tax exp interest expense 39. 40. debt to equity ratio net income-preferred dividends average total equity (see Notes 1 and 2 below) gross profit percentage total liabilities total stockholders' equity gross profit sales (in thousands) Current Assets Cash and cash equivalents Total current assets Property, plant and equipment, net Operating lease right-of-use assets Intangible assets, net Goodwill Deferred income taxes Other non-current assets Total assets Short-term investments Accounts receivable, net of allowance of 8,893 and 21,810, respectively Inventories, net Prepaid expenses and other current assets Current Liabilities: Accounts payable Accrued liabilities Operating lease liabilities Income taxes payable Total current liabilities Non-current operating lease liabilities Income taxes payable Deferred income taxes Other long-term liabilities Total labides CONSOLIDATED BALANCE SHEETS ASSETS Total shareholders' equity Total liabilites and shareholders' equity LIABILITIES AND EQUITY Commitments and contingencies (Note 12) Shareholders' Equity Preferred stock: 10,000 shares authorized: none issued and outstanding Common stock (no par value); 250,000 shares authorized; 65,164 and 66,252 issued and outstanding. respectively Retained earnings Accumulated other comprehensive income (loss) $ $ $ $ 2021 December 31, 763,404 $ 131,145 487,803 645,379 86,306 2,114,037 291,088 330,928 101,908 68,594 92,121 1931 68,452 3,067,128 $ 283,349 $ 316,485 67,429 13.127 680,390 317,666 44,541 35.279 1,077,876 1,993.628 (4.376) 1,989,252 3,067,128 $ 2020 790,725 1,224 452,945 556,530 54.197 1,855,621 309,792 339,244 103,558 68,594 96,126 63,636 2,836,571 206,697 257,278 65,466 23,181 552,622 353.181 49,922 5,205 42,870 1,003,800 20,165 1,811,800 806 1,832,771 2,836,571 sands, except per share amounts e, January 1, 2019 ome ise of non-controlling interest comprehensive Income (loss) Unrealized holding gains on available-for-sale securities, net Unrealized holding losses on derivative transactions, net ign currency translation adjustment, net vidends ($0.96 per share) Issuance of common stock related to stock- based compensation, net based compensation expense hase of common stock e, December 31, 2019 ome comprehensive income (loss) Unrealized holding gains on available-for-sale securities, net Unrealized holding losses on derivative transactions, net sign currency translation adjustment, net lividends ($0.26 per share) Issuance of common stock related to stock- based compensation, net based compensation expense hase of common stock e, December 31, 2020 ome comprehensive income (loss) Unrealized holding gains on derivative transactions, net ign currency translation adjustment, net lividends ($1.04 per share) Issuance of common stock related to stock- based compensation, net based compensation expense hase of common stock e, December 31, 2021 Coomed Water Company SMENT S Commen Stock Shares Outstanding Amount Ratained Earnings 68,245 1,678920 330,489 11 (1,243) 67,561 THE 248 (1,557) 66.252 11 567 (1,655) 65.164 R THE B111 $ 13,987 17,832 (26,882) 4,937 2,386 17,778 (4.936) 20,165 22,971 19,126 (62.262) SILE (65,127) (94,347) 1,848,935 108.013 (17,195) (127.953) 1,811,800 354,108 118 11 (68,623) Accumulated Other Comprehensive Income (Lesson-Controlling interest Total 16,456 (103.657) 1,993628 (4,063) (99) (2,383) 2,064 (4,425) (18,851) 24,078 18111 199 806 19,283 (24,465) THIS (4.376) (16,456) BHHEHLE THE ITE I 11111 & 1,690,313 330,489 (16,555) 56 (2,383) 2,064 (65,127) 13,987 17,832 (121,229) 1,849,447 108,013 (18,851) 24,078 (17.195) 2,386 17,778 (132,889) 1,832,771 354,108 19,283 (24,465) (68,623) 22,971 19,126 (165,919) 1,989,252 and w from operating activities Adjustments to reconcile net income to net cash provided by operating active ciation, amortization, and non-cash lease expense ision for uncollectible accounts receivable Loss on disposal or impairment of intangible assets, property, plant and equipment, and right-of-use ase ed income taxes based compensation in operating assets and tables unts receivable ories, net ad expenses and other current se rest unts payable udables e taves payable ingesesses and lab lab provided by operating acti ws from investing activities hases of short-term investments s and matures of short-term investments tal expenditures provided by (used in investing activites w from financing activi eeds from credit fac syments on credit fac ment of line of credit issuance fees eeds from lesuance of common stock related to stock-based compensation payments related to stock-based compensation chase of common stock hase of non-controlling inter dividend paid used in financing activities et of exchange rate changes on cash esse (decrease) in cash and cash equivalents d cash equivalents, beginning of period sd cash equivalents, and of period mental disclosures of cash flow information paid during the year for income tax mental disclosures of non-cash investing and financing activities: erty, plant and equipment acquired through increase in labilities S $ 2021 Year Ended December 31, 2020 1,108 115,571 (10.758) 1.233 (9,794) 19,126 (31,622) (100,261) (24,858) 1.231 75.513 60457 (15,248) (85,176) (1.112) 354,406 (130,191) 1,184 (34,744) (163.751) 36.334 (38,156) - 28,783 (5,812) (165,415) (68623) (210) (7.087) (27,321) 790,725 749,404 13.483 5.863 108.013 140,001 10,156 31,342 (11,203) 17,778 22.885 64,854 33,712 (21,224) (49,275) (52.115) 9.082 (52,112) 6,613 276.077 (35,044) 36,631 (28.754) (27.171) 402,422 (403,146) (3,278) 6,919 (4,533) (132,669) (17,195) (151,700) 7,510 104,716 686.000 700 725 14.687 3,831 2019 330,489 121,725 (10) 5,442 (1808) 17.432 (37 429) (64,058) (15,008) (3.547) (10.419) 18,863 (9,402) (54.197) 7-137 205,452 (136,257) 400,501 (123.516) 140,728 78,166 (78,186) 19,793 (5.806) (121,702) (17,880) (65,127) (190,722) (1.244) 234,214 451,795 605.009 99062 9,543 sands) ome CONSOLIDATED STATEMENTS OF COMPREHENSIVE INCOME Year Ended December 31, 2020 comprehensive income (loss): Unrealized holding gains on available-for-sale securities, neti Unrealized holding gains (losses) on derivative transactions (net of tax effects of $(7,138), $6,271, and $830, respectively) Foreign currency translation adjustments (net of tax effects of $( 40), 5(388), and $2,188, respectively) comprehensive income (loss) ehensive income 2021 354$108 19,283 (24,465) (5.182) 348,926 See accompanying notes to consolidated financial statements. 1085013 (18,851) 24.078 5,231 113,244 2019 330,489 56 (2,383) 2,064 (263) 330,226 COLUMBIA SPORTSWEAR COMPANY | 2021 FORM 10-K141 CONSOLIDATED STATEMENTS (in thousands, except per share amounts) Net sales Cost of sales Gross profit Selling, general and administrative expenses Net licensing income Operating income Interest income, net Other non-operating income (expense), net Income before income tax Income tax expense Net income Eamings per share: Basic Diluted Weighted average shares outstanding Basic Diluted $ 2021 Year Ended December 31, 2020 3,126,402 $ 1,513,947 1,612,455 1,180,323 18,372 450,504 1,380 (373) 451,511 (97.403) 354,108 5.37 S 5.33 $ 65,942 66,415 See accompanying notes to consolidated financial statements. 2,501,554 $ 1,277,665 1,223,889 1,098,948 12,108 137,049 435 2,039 139,523 (31,510) 108,013 1.63 $ 1.62 $ 66,376 66,772 2019 3,042,478 1,526,808 1,515,670 1,136,186 15,487 394,971 8,302 2,156 405,429 (74,940) 330,489 4.87 4.83 67,837 68,493 COLUMBIA SPORTSWEAR COMPANY I2021 FORM 10-K140 (in millions, except for percentage of net sales and per share amounts) Net sales Cost of sales Gross profit Selling, general and administrative expenses Net licensing income Operating income Interest income, net Other non-operating income (expense), net Income before income tax Income tax expense Net income (in millions, except for percentages) Brand Net Sales: Columbia SOREL prAna Diluted earnings per share Net Sales. Net sales by brand, product category and channel are summarized in the following table: Reported Net Sales 2021 2.557.4 $ 320.9 141.9 Adjust for Foreign Currency Translation 3,126.4 1,513.9 1,612.5 1,180.3 18.3 450.5 14 (0.4) 451.5 (97.4) 354.1 (26.4) S (2.4) 5.33 2021 Constant- currency Net Sales 2021 () Year Ended December 31, Year Ended December 31, 2,531.0 $ 318.5 141.9 100.0 % $ 48.4% 51.6% 37.8% 0.6% 14.4% 14.4% (3.1)% 11.3% $ Reported Net Sales 2020 % % 1,996.9 293.5 131.6 Reported Net Sales % Change 28% 9% 8% 2,501.6 1,277.7 1,223.9 1,098.9 12.0 137.0 0.4 2.1 139.5 (31.5) 108.0 1.62 2020 100.0 % 51.1% 48.9% 43.9% 0.5% 27% 9% 8% 5.5% -% 0.1% 5.6 % (1.3)% 4.3 % Constant-currency Net Sales % Change) the non-recurrence of prior year expenses of $18.9 million related to the COVID-19 pandemic; and the non-recurrence of prior year prAna brand trademark impairment charge of $17.5 million. Income Tax Expense. Income tax expense and the related effective income tax rate is summarized in the following table: (in millions, except for percentages) Income tax expense Effective income tax rate 2021 (97.4) 21.6% $ Year Ended December 31, 2020 (31.5) $ 22.6% Change (65.9) 209% Cash Flow Activities Cash flows from continuing operations are summarized in the following table: (in millions) Cash and cash equivalents Net cash provided by (used in): Operating activities Investing activities Financing activities Net effect of exchange rate changes on cash Net increase (decrease) in cash and cash equivalents $ 2021 Year Ended December 31, 2020 763.4 $ 354.4 $ (163.8) (210.9) (7.0) (27.3) S 790.7 $ 276.1 S (27.2) (151.7) 7.5 104.7 S Change (27.3 78.3 (136.6 (59.2 (14.5 (132.0 The change in cash flows provided by operating activities was driven by a $157.8 million increase in net income and non-cash adjustments, partially offset by $79.5 million increase in cash used in changes in assets and liabilities. The most significant comparative changes included Inventories, net, Accounts payable Accrued liabilities, Prepaid expenses and other current assets, Accounts receivable, and Operating lease assets and liabilities. The $165.1 million increase in cash used in Inventories, net was mainly driven by an increase in inventory purchases reflecting strong consumer demand. The $124.8 million increase in cash provided by Accounts payable primarily reflects the effects of higher receipts of inventory in the fourth quarter of 2021 compared to the fourth quarter of 202C due to stronger customer demand and increased in-transit inventory. The $118.6 million increase in cash provided by Accrued liabilities was primarily driven by up for incentive compensation as well as DTC return liabilities. The $58.6 million increase in cash used in Prepaid expenses and other assets eh used in Accounts receivable was In millions, except for percentage changes U.S. LAAP EMEA Canada In mon U.S. LAAP EMEA Canada $ Total segment operating income Unallocated corporate expenses Operating income Reported Net Sales 2021 Adjust for Foreign Currency Translation 2,060.3 $ 465.5 382.1 218.5 312845 S 2,060.3 S (7.5) 458.0 (9.0) 373.1 205.7 (128) (29.3) S 3.097.1 $ Constancy net sales is a non-GAAP financial measure See on-GAAP Financial Messure above for further information Operating income for each reportable segments and unallocated corporate expenses are summarized in the following table Year Ended December 31, Constant currency Net Sales 2021 Reported Net Sales 2020 1,603.8 424.5 298.9 174.4 2.501.6 2021 Reported Net Sales % Change 29% 10% 536.5 S 42.0 65.5 52.7 696.7 (2462) 450.5 $ 28% 25% 25% Year Ended December 31, 2020 Constant-currency Net Sales % Change 250.5 S 35.9 31.2 37.6 355.2 (2182) 137.0 S 28% 8% 25% 18% 24% Change 286.0 6.1 34.3 15.1 341.5 (280) 313.5 Interest income, net 2021- $1,380 2020- $435 2019- $8,302
Operating income 2021- $450,504 2020- $137,049 2019- $394,971
Step by Step Solution
There are 3 Steps involved in it
Step: 1

Get Instant Access to Expert-Tailored Solutions
See step-by-step solutions with expert insights and AI powered tools for academic success
Step: 2

Step: 3
Ace Your Homework with AI
Get the answers you need in no time with our AI-driven, step-by-step assistance
Get Started
Financial Accounting in an Economic Context
Authors: Jamie Pratt
8th Edition
9781118139424, 9781118139431, 470635290, 1118139429, 1118139437, 978-0470635292