

Answered step by step
Verified Expert Solution
Question
1 Approved Answer
Need help with question 6 ASAP. The Data for the proboem is attached 6. Annual data on U.S. and international returns are provided on ICON
Need help with question 6 ASAP. The Data for the proboem is attached 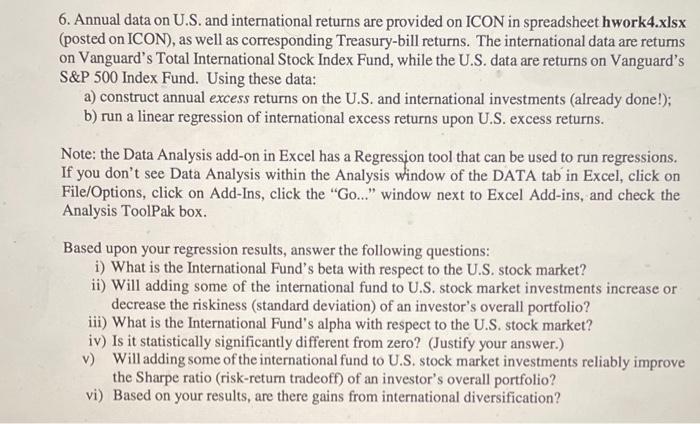
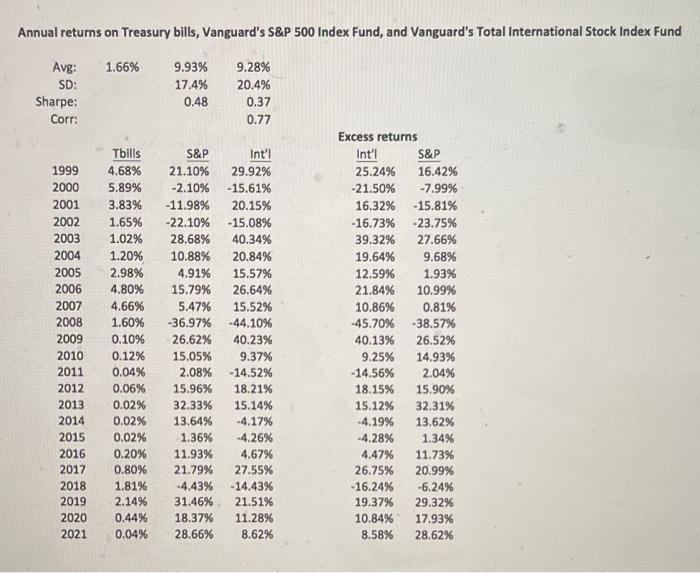
6. Annual data on U.S. and international returns are provided on ICON in spreadsheet hwork4.xlsx (posted on ICON), as well as corresponding Treasury-bill returns. The international data are returns on Vanguard's Total International Stock Index Fund, while the U.S. data are returns on Vanguard's S&P 500 Index Fund. Using these data: a) construct annual excess returns on the U.S. and international investments (already done!); b) run a linear regression of international excess returns upon U.S. excess returns. Note: the Data Analysis add-on in Excel has a Regression tool that can be used to run regressions. If you don't see Data Analysis within the Analysis window of the DATA tab in Excel, click on File/Options, click on Add-Ins, click the "Go." window next to Excel Add-ins, and check the Analysis ToolPak box. Based upon your regression results, answer the following questions: i) What is the International Fund's beta with respect to the U.S. stock market? ii) Will adding some of the international fund to U.S. stock market investments increase or decrease the riskiness (standard deviation) of an investor's overall portfolio? iii) What is the International Fund's alpha with respect to the U.S. stock market? iv) Is it statistically significantly different from zero? (Justify your answer.) v) Will adding some of the international fund to U.S. stock market investments reliably improve the Sharpe ratio (risk-return tradeoff) of an investor's overall portfolio? vi) Based on your results, are there gains from international diversification? Annual returns on Treasury bills, Vanguard's S&P 500 Index Fund, and Vanguard's Total International Stock Index Fund 1.66% Avg: SD: Sharpe: Corr: 9.93% 17.4% 0.48 9.28% 20.4% 0.37 0.77 1999 2000 2001 2002 2003 2004 2005 2006 2007 2008 2009 2010 2011 2012 2013 2014 2015 2016 2017 2018 2019 2020 2021 Tbilis 4.68% 5.89% 3.83% 1.65% 1.02% 1.20% 2.98% 4.80% 4.66% 1.60% 0.10% 0.12% 0.04% 0.06% 0.02% 0.02% 0.02% 0.20% 0.80% 1.81% 2.14% 0.44% 0.04% S&P 21.10% -2.10% -11.98% -22.10% 28.68% 10.88% 4.91% 15.79% 5.47% -36.97% 26.62% 15.05% 2.08% 15.96% 32.33% 13.64% 1.36% 11.93% 21.79% -4.43% 31.46% 18.37% 28.66% Int'l 29.92% - 15.61% 20.15% - 15.08% 40.34% 20.84% 15.57% 26.64% 15.52% -44.10% 40.23% 9.37% - 14.52% 18.21% 15.14% -4.17% -4.26% 4.67% 27.55% -14.43% 21.51% 11.28% 8.62% Excess returns Int'i S&P 25.24% 16.42% -21.50% -7.99% 16.32% - 15.81% - 16.73% -23.75% 39.32% 27.66% 19.64% 9.68% 12.59% 1.93% 21.84% 10.99% 10.86% 0.81% -45.70% -38.57% 40.13% 26.52% 9.25% 14.93% -14.56% 2.04% 18.15% 15.90% 15.12% 32.31% -4.19% 13.62% -4.28% 1.34% 4.47% 11.73% 26.75% 20.99% -16.24% -6.24% 19.37% 29.32% 10.84% 17.93% 8.58% 28.62% 6. Annual data on U.S. and international returns are provided on ICON in spreadsheet hwork4.xlsx (posted on ICON), as well as corresponding Treasury-bill returns. The international data are returns on Vanguard's Total International Stock Index Fund, while the U.S. data are returns on Vanguard's S&P 500 Index Fund. Using these data: a) construct annual excess returns on the U.S. and international investments (already done!); b) run a linear regression of international excess returns upon U.S. excess returns. Note: the Data Analysis add-on in Excel has a Regression tool that can be used to run regressions. If you don't see Data Analysis within the Analysis window of the DATA tab in Excel, click on File/Options, click on Add-Ins, click the "Go." window next to Excel Add-ins, and check the Analysis ToolPak box. Based upon your regression results, answer the following questions: i) What is the International Fund's beta with respect to the U.S. stock market? ii) Will adding some of the international fund to U.S. stock market investments increase or decrease the riskiness (standard deviation) of an investor's overall portfolio? iii) What is the International Fund's alpha with respect to the U.S. stock market? iv) Is it statistically significantly different from zero? (Justify your answer.) v) Will adding some of the international fund to U.S. stock market investments reliably improve the Sharpe ratio (risk-return tradeoff) of an investor's overall portfolio? vi) Based on your results, are there gains from international diversification? Annual returns on Treasury bills, Vanguard's S&P 500 Index Fund, and Vanguard's Total International Stock Index Fund 1.66% Avg: SD: Sharpe: Corr: 9.93% 17.4% 0.48 9.28% 20.4% 0.37 0.77 1999 2000 2001 2002 2003 2004 2005 2006 2007 2008 2009 2010 2011 2012 2013 2014 2015 2016 2017 2018 2019 2020 2021 Tbilis 4.68% 5.89% 3.83% 1.65% 1.02% 1.20% 2.98% 4.80% 4.66% 1.60% 0.10% 0.12% 0.04% 0.06% 0.02% 0.02% 0.02% 0.20% 0.80% 1.81% 2.14% 0.44% 0.04% S&P 21.10% -2.10% -11.98% -22.10% 28.68% 10.88% 4.91% 15.79% 5.47% -36.97% 26.62% 15.05% 2.08% 15.96% 32.33% 13.64% 1.36% 11.93% 21.79% -4.43% 31.46% 18.37% 28.66% Int'l 29.92% - 15.61% 20.15% - 15.08% 40.34% 20.84% 15.57% 26.64% 15.52% -44.10% 40.23% 9.37% - 14.52% 18.21% 15.14% -4.17% -4.26% 4.67% 27.55% -14.43% 21.51% 11.28% 8.62% Excess returns Int'i S&P 25.24% 16.42% -21.50% -7.99% 16.32% - 15.81% - 16.73% -23.75% 39.32% 27.66% 19.64% 9.68% 12.59% 1.93% 21.84% 10.99% 10.86% 0.81% -45.70% -38.57% 40.13% 26.52% 9.25% 14.93% -14.56% 2.04% 18.15% 15.90% 15.12% 32.31% -4.19% 13.62% -4.28% 1.34% 4.47% 11.73% 26.75% 20.99% -16.24% -6.24% 19.37% 29.32% 10.84% 17.93% 8.58% 28.62% Step by Step Solution
There are 3 Steps involved in it
Step: 1

Get Instant Access to Expert-Tailored Solutions
See step-by-step solutions with expert insights and AI powered tools for academic success
Step: 2

Step: 3
Ace Your Homework with AI
Get the answers you need in no time with our AI-driven, step-by-step assistance
Get Started
Financial Markets And Institutions
Authors: Anthony Saunders, Marcia Cornett
4th Edition
0077262379, 978-0077262372