Answered step by step
Verified Expert Solution
Link Copied!

Question

1 Approved Answer

Need Help with question 7 with explanation of the answer thank you. 80 94 58 66 56 82 78 86 88 56 40 66 84

Need Help with question 7 with explanation of the answer thank you.
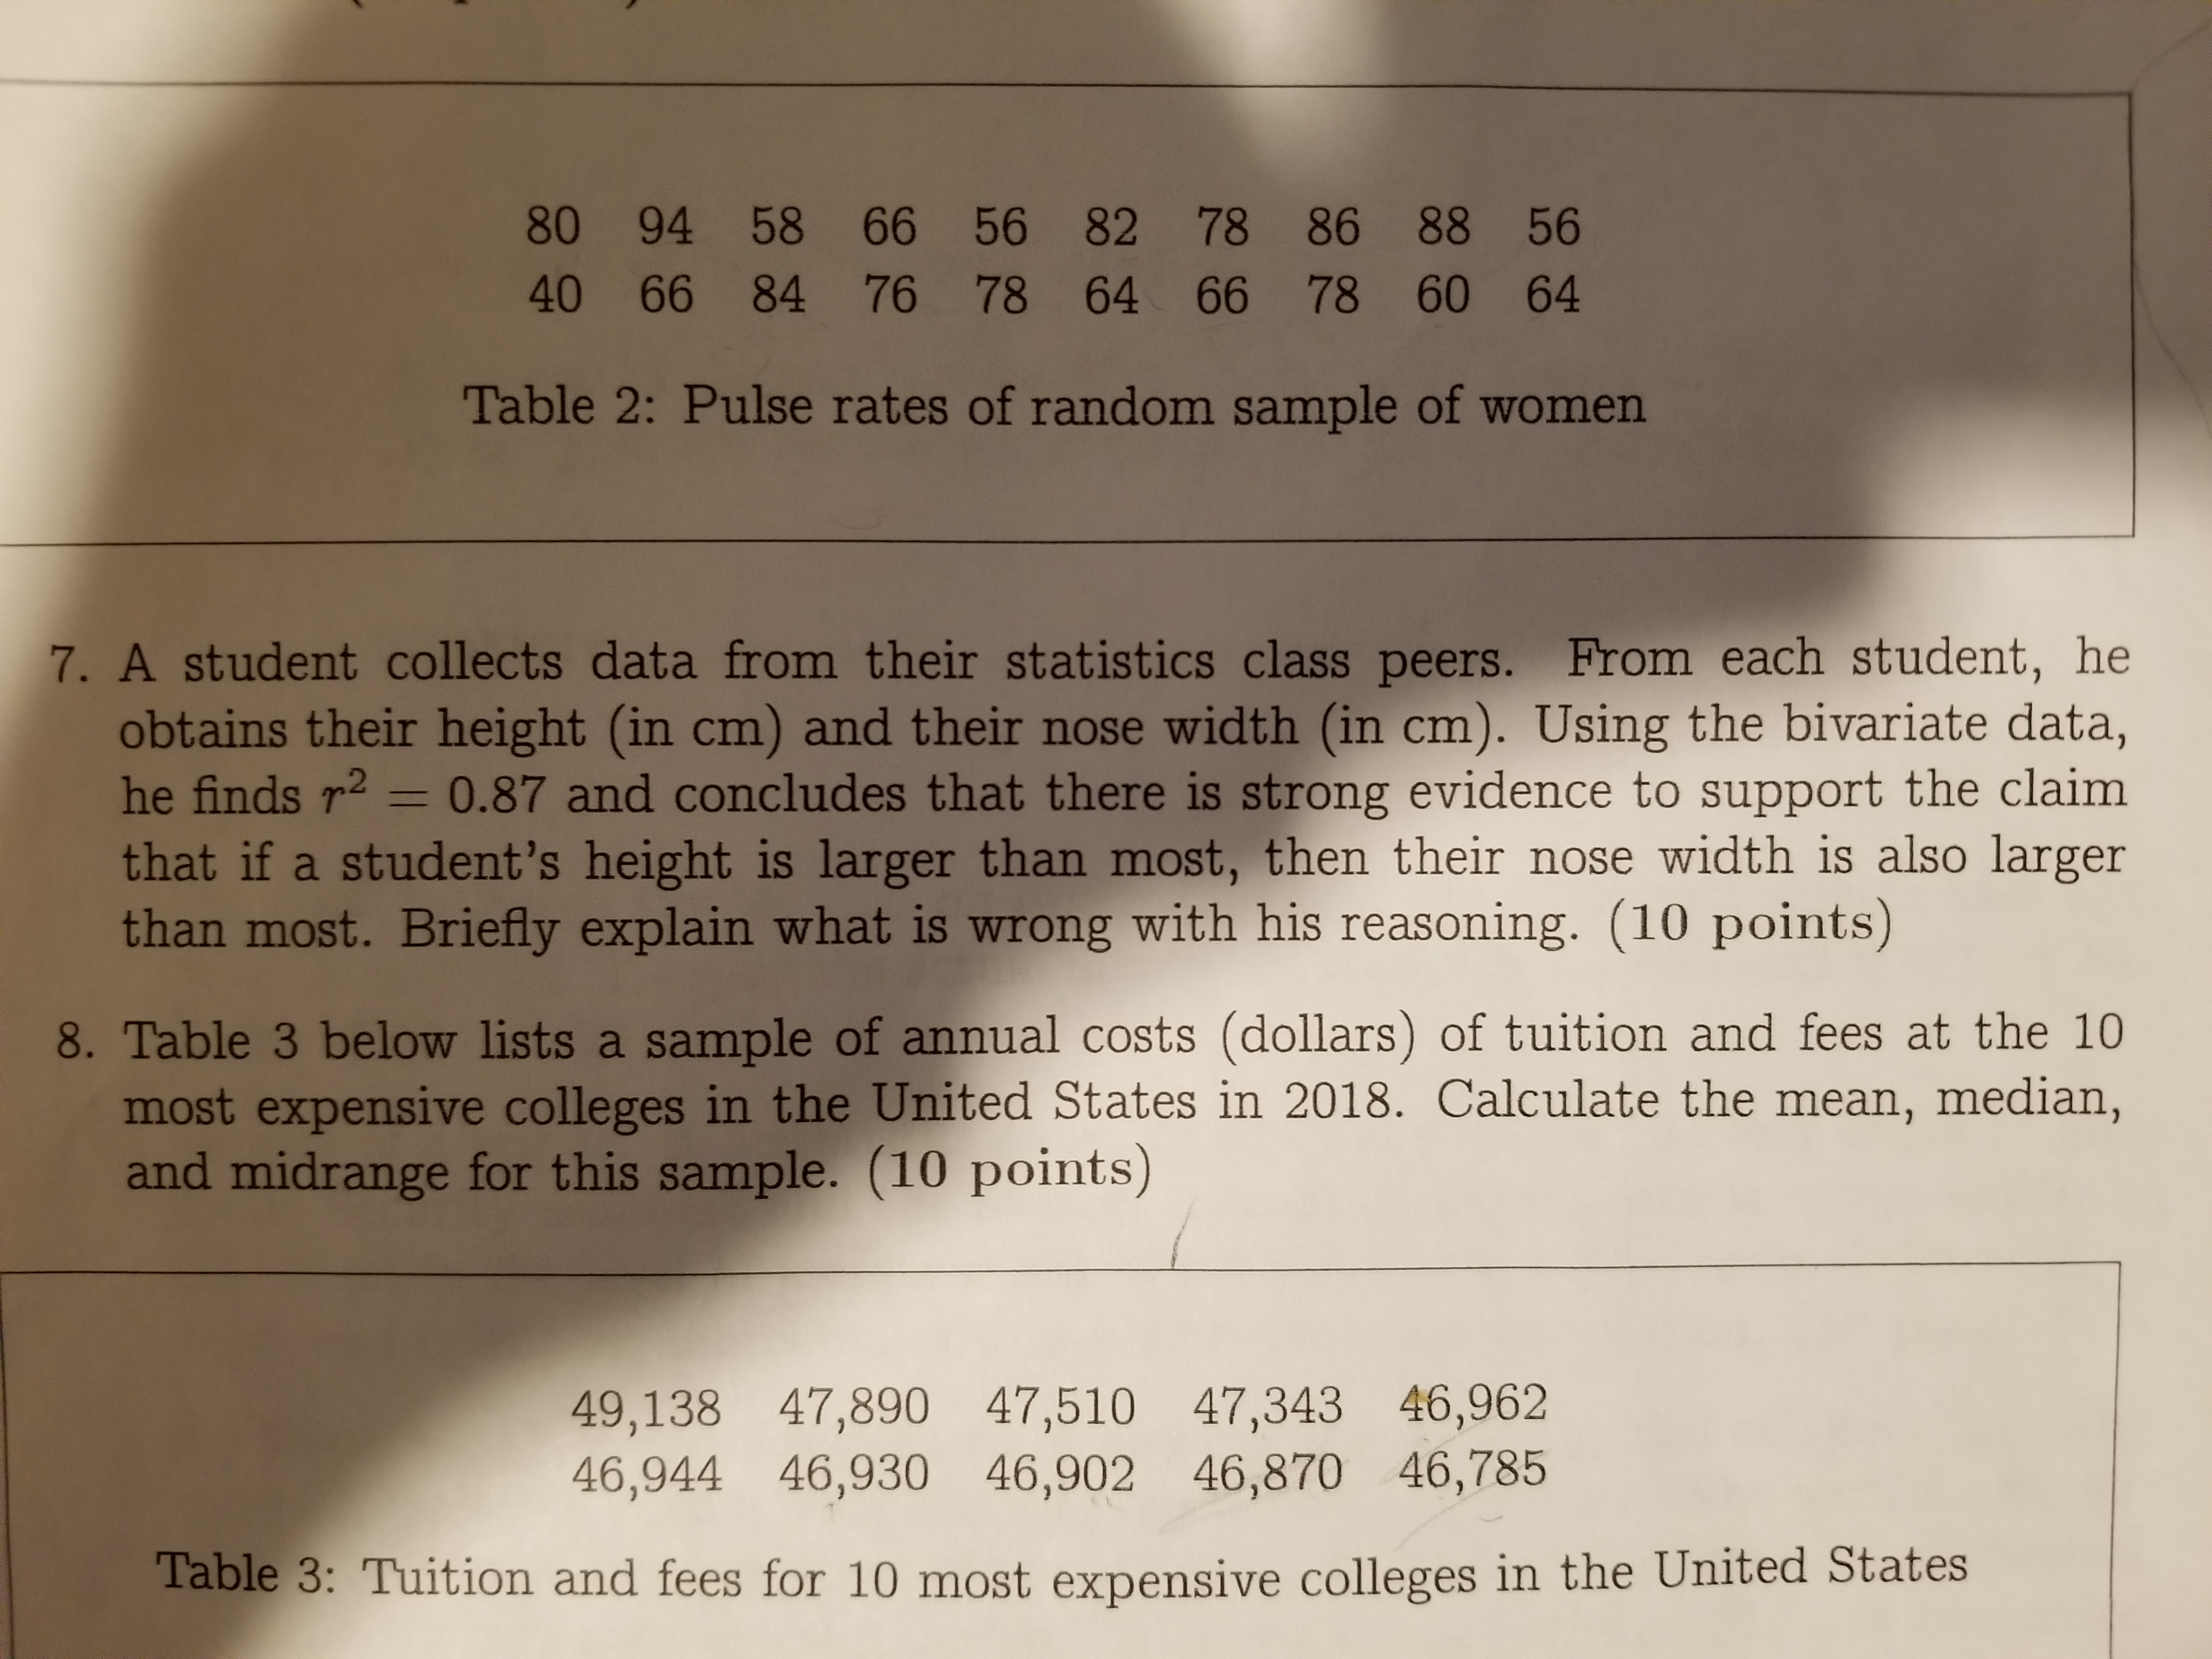
image text in transcribed
80 94 58 66 56 82 78 86 88 56 40 66 84 76 78 64 66 78 60 64 Table 2: Pulse rates of random sample of women 7. A student collects data from their statistics class peers. From each student, he obtains their height (in cm) and their nose width (in cm). Using the bivariate data, he finds r2 = 0.87 and concludes that there is strong evidence to support the claim that if a student's height is larger than most, then their nose width is also larger than most. Briefly explain what is wrong with his reasoning. (10 points) 8. Table 3 below lists a sample of annual costs (dollars) of tuition and fees at the 10 most expensive colleges in the United States in 2018. Calculate the mean, median, and midrange for this sample. (10 points) 49, 138 47,890 47,510 47,343 46,962 46,944 46,930 46,902 46,870 46,785 Table 3: Tuition and fees for 10 most expensive colleges in the United States

Step by Step Solution

There are 3 Steps involved in it

Step: 1

blur-text-image

Get Instant Access to Expert-Tailored Solutions

See step-by-step solutions with expert insights and AI powered tools for academic success

Step: 2

blur-text-image

Step: 3

blur-text-image

Ace Your Homework with AI

Get the answers you need in no time with our AI-driven, step-by-step assistance

Get Started

Recommended Textbook for

Essentials of Business Analytics

Authors: Jeffrey D. Camm, James J. Cochran, Michael J. Fry, Jeffrey W. Ohlmann, David R. Anderson

2nd edition

1305627733, 978-1305861817, 1305861817, 978-0357688960, 978-1305627734

More Books

Students also viewed these Mathematics questions