Answered step by step
Verified Expert Solution
Question
1 Approved Answer
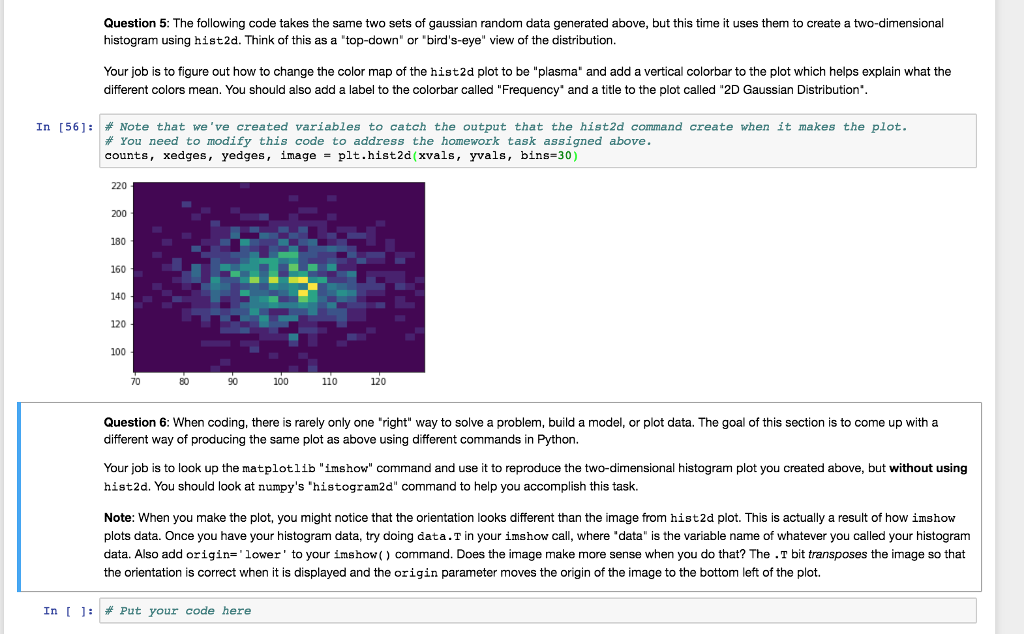
Need help with questions 6. The value that need to be plotted are also shown. Has to be done through python and hist2d command cant


Need help with questions 6. The value that need to be plotted are also shown. Has to be done through python and hist2d command cant be used. PLEASE HELP!!!!
Question 5: The following code takes the same two sets of gaussian random data generated above, but this time it uses them to create a two-dimensional histogram using hist2d. Think of this as a "top-down" or "bird's-eye" view of the distribution. Your job is to figure out how to change the color map of the hist2d plot to be "plasma" and add a vertical colorbar to the plot which helps explain what the different colors mean. You should also add a label to the colorbar called "Frequency and a title to the plot called "2D Gaussian Distribution In [56]: | # Note that we've created variables to catch the output that the hist2d command create when it makes the plot. # You need to modify this code to address the homework task assigned above. counts, xedges, yedges, image - pit.hist2d(xvals, yvals, bins-30) 200 180 160 140 120 100 70 80 90 100 110 120 Question 6: When coding, there is rarely only one "right" way to solve a problem, build a model, or plot data. The goal of this section is to come up with a different way of producing the same plot as above using different commands in Python. Your job is to look up the matplotlib "imshow" command and use it to reproduce the two-dimensional histogram plot you created above, but without using hist2d. You should look at numpy's 'histogram2d" command to help you accomplish this task. Note: When you make the plot, you might notice that the orientation looks different than the image from hist2d plot. This is actually a result of how imshow plots data. Once you have your histogram data, try doing data. T in your imshow call, where" data" is the variable name of whatever you called your histogram data. Also add origin=' lower' to your imshow() command. Does the image make more sense when you do that? The . T bit transposes the image so that the orientation is correct when it is displayed and the origin parameter moves the origin of the image to the bottom left of the plot. In [ ]: | # Put your code here Question 5: The following code takes the same two sets of gaussian random data generated above, but this time it uses them to create a two-dimensional histogram using hist2d. Think of this as a "top-down" or "bird's-eye" view of the distribution. Your job is to figure out how to change the color map of the hist2d plot to be "plasma" and add a vertical colorbar to the plot which helps explain what the different colors mean. You should also add a label to the colorbar called "Frequency and a title to the plot called "2D Gaussian Distribution In [56]: | # Note that we've created variables to catch the output that the hist2d command create when it makes the plot. # You need to modify this code to address the homework task assigned above. counts, xedges, yedges, image - pit.hist2d(xvals, yvals, bins-30) 200 180 160 140 120 100 70 80 90 100 110 120 Question 6: When coding, there is rarely only one "right" way to solve a problem, build a model, or plot data. The goal of this section is to come up with a different way of producing the same plot as above using different commands in Python. Your job is to look up the matplotlib "imshow" command and use it to reproduce the two-dimensional histogram plot you created above, but without using hist2d. You should look at numpy's 'histogram2d" command to help you accomplish this task. Note: When you make the plot, you might notice that the orientation looks different than the image from hist2d plot. This is actually a result of how imshow plots data. Once you have your histogram data, try doing data. T in your imshow call, where" data" is the variable name of whatever you called your histogram data. Also add origin=' lower' to your imshow() command. Does the image make more sense when you do that? The . T bit transposes the image so that the orientation is correct when it is displayed and the origin parameter moves the origin of the image to the bottom left of the plot. In [ ]: | # Put your code hereStep by Step Solution
There are 3 Steps involved in it
Step: 1

Get Instant Access to Expert-Tailored Solutions
See step-by-step solutions with expert insights and AI powered tools for academic success
Step: 2

Step: 3

Ace Your Homework with AI
Get the answers you need in no time with our AI-driven, step-by-step assistance
Get Started


