need help with required 1-2 . appendix a at the bottom.
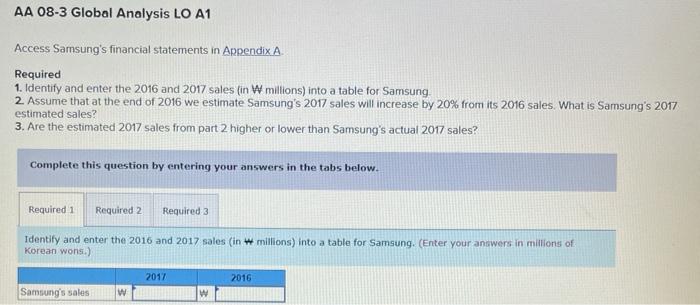
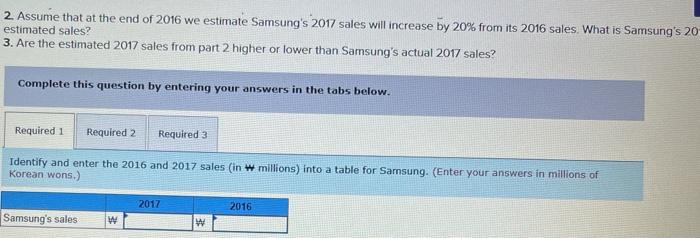
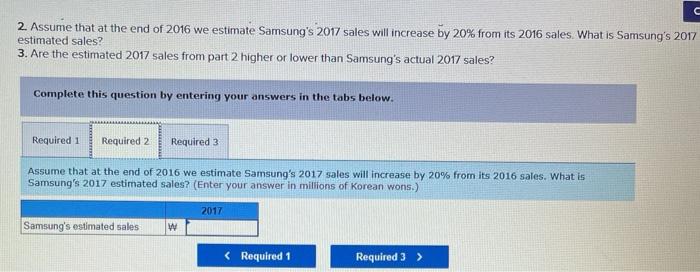
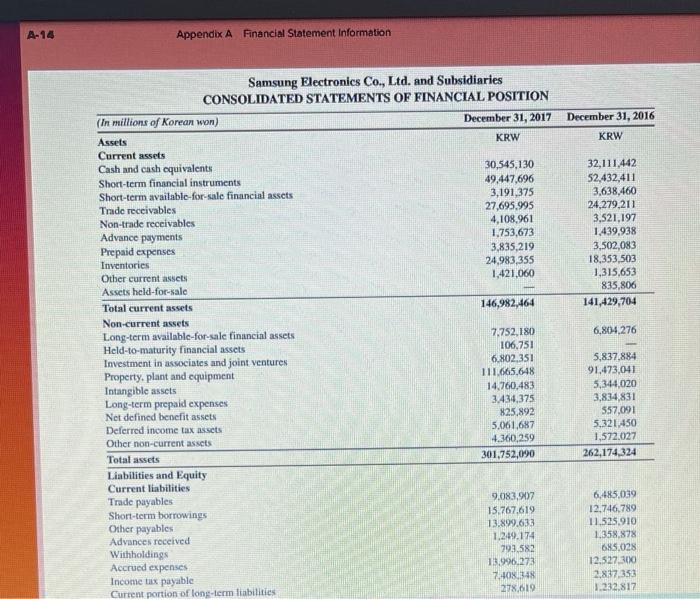
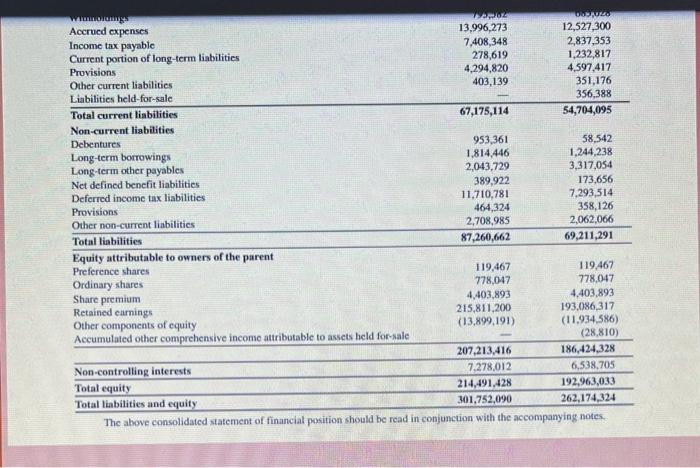
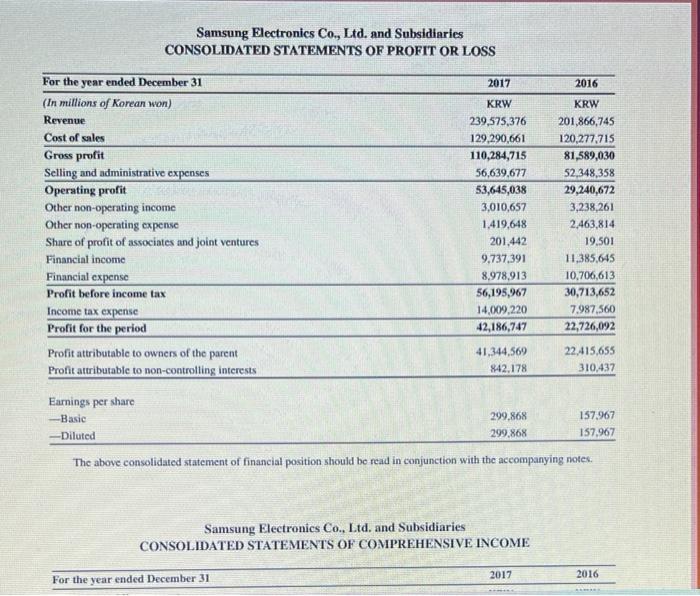
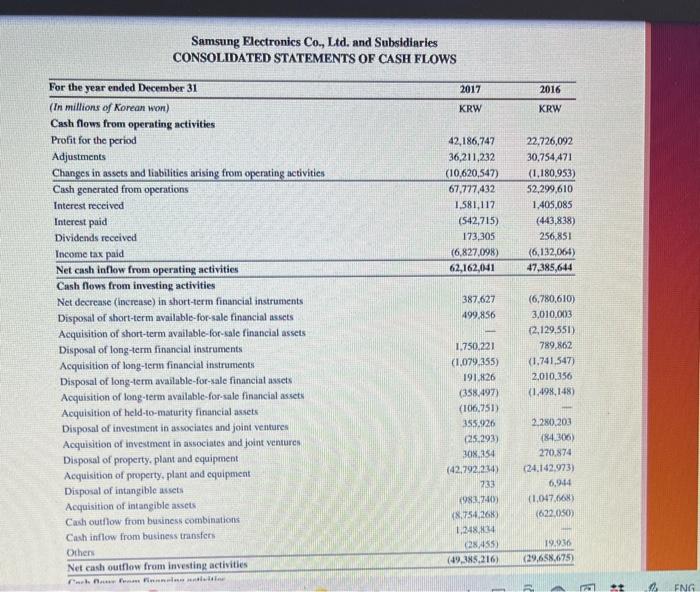
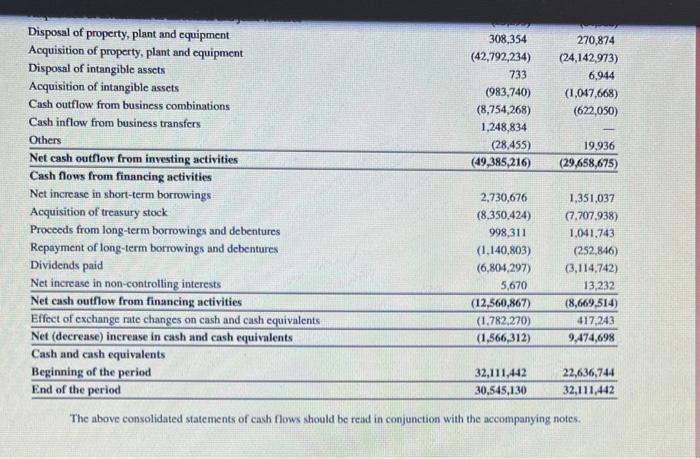
AA 08-3 Global Analysis LO A1 Access Samsung's financial statements in Appendix A Required 1. Identify and enter the 2016 and 2017 sales (in W millions) into a table for Samsung 2. Assume that at the end of 2016 we estimate Samsung's 2017 sales will increase by 20% from its 2016 sales. What is Samsung's 2017 estimated sales? 3. Are the estimated 2017 sales from part 2 higher or lower than Samsung's actual 2017 sales? Complete this question by entering your answers in the tabs below. Required 1 Required 2 Required 3 Identity and enter the 2016 and 2017 sales (in millions) into a table for Samsung. (Enter your answers in millions of Korean wons.) 2017 2016 Samsung's sales w w 2. Assume that at the end of 2016 we estimate Samsung's 2017 sales will increase by 20% from its 2016 sales. What is Samsung's 20 estimated sales? 3. Are the estimated 2017 sales from part 2 higher or lower than Samsung's actual 2017 sales? Complete this question by entering your answers in the tabs below. Required 1 Required 2 Required 3 Identify and enter the 2016 and 2017 sales (in w millions) into a table for Samsung. (Enter your answers in millions of Korean wons.) 2017 2016 Samsung's sales W w U 2. Assume that at the end of 2016 we estimate Samsung's 2017 sales will increase by 20% from its 2016 sales. What is Samsung's 2017 estimated sales? 3. Are the estimated 2017 sales from part 2 higher or lower than Samsung's actual 2017 sales? Complete this question by entering your answers in the tabs below. Required 1 Required 2 Required 3 Assume that at the end of 2016 we estimate Samsung's 2017 sales will increase by 20% from its 2016 sales. What is Samsung's 2017 estimated sales? (Enter your answer in millions of Korean wons.) 2017 Samsung's estimated sales W A-14 Appendix A Financial Statement Information December 31, 2016 KRW 32,111,442 52,432,411 3,638,460 24,279,211 3,521,197 1.439,938 3,502,083 18.353,503 1,315,653 835,806 141,429,704 6,804,276 Samsung Electronics Co., Ltd. and Subsidiaries CONSOLIDATED STATEMENTS OF FINANCIAL POSITION (In millions of Korean won) December 31, 2017 Assets KRW Current assets Cash and cash equivalents 30,545,130 Short-term financial instruments 49.447,696 Short-term available for sale financial assets 3,191,375 Trade receivables 27,695.995 Non-trade receivables 4,108,961 Advance payments 1,753,673 Prepaid expenses 3,835,219 Inventories 24.983,355 Other current assets 1,421,060 Assets held-for-sale Total current assets 146,982,464 Non-current assets Long-term available-for-sale financial assets 7,752,180 Held-to-maturity financial assets 106.751 Investment in associates and joint ventures 6,802.351 Property, plant and equipment 111.665.648 Intangible assets 14,760,483 Long-term prepaid expenses 3.434,375 Net defined benefit assets 825,892 Deferred income tax assets 5.061.687 Other non-current assets 4.360.259 Total assets 301,752,090 Liabilities and Equity Current liabilities Trade payables 9.083,907 Short-term borrowings 15.767.619 Other payables 13.899.633 Advances received 1.249.174 Withholdings 793,582 Accrued expenses 11.996.273 Income tax payable 708148 Current portion of long-term liabilities 278.012 5,837,884 91.473,041 5,344,020 3,834,831 557,091 5.321450 1.572.027 262,174,324 6,485.039 12.746,789 11.525.910 1.358,878 685.028 12.527.300 1,837350 1.232.817 WOME Accrued expenses 13,996,273 12,527,300 Income tax payable 7,408,348 2,837,353 Current portion of long-term liabilities 278,619 1,232,817 Provisions 4,294,820 4,597,417 Other current liabilities 403,139 351,176 Liabilities held-for-sale 356,388 Total current liabilities 67,175,114 54,704,095 Non-current liabilities Debentures 953,361 58,542 Long-term borrowings 1.814.446 1.244.238 Long-term other payables 2,043,729 3,317,054 Net defined benefit liabilities 389,922 173,656 Deferred income tax liabilities 11,710,781 7,293,514 Provisions 464,324 358,126 Other non-current liabilities 2,708,985 2,062,066 Total liabilities 87,260,662 69,211,291 Equity attributable to owners of the parent Preference shares 119.467 119.467 Ordinary shares 778,047 778,047 Share premium 4,403,893 4.403,893 Retained earnings 215,811.200 193.086,317 Other components of equity (13,899,191) (11.934,586) Accumulated other comprehensive income attributable to assets held for sale (28,810) 207,213,416 186,424,328 Non-controlling interests 7,278,012 6,538,705 Total equity 214,491,428 192,963,033 Total liabilities and equity 301.752,090 262,174,324 The above consolidated statement of financial position should be read in conjunction with the accompanying notes Samsung Electronics Co., Ltd. and Subsidiaries CONSOLIDATED STATEMENTS OF PROFIT OR LOSS For the year ended December 31 (In millions of Korean won) Revenue Cost of sales Gross profit Selling and administrative expenses Operating profit Other non-operating income Other non-operating expense Sharc of profit of associates and joint ventures Financial income Financial expense Profit before income tax Income tax expense Profit for the period Profit attributable to owners of the parent Profit attributable to non-controlling interests 2017 KRW 239,575,376 129.290,661 110,284,715 56,639.677 53,645,038 3,010,657 1,419,648 201.442 9,737,391 8,978,913 56,195,967 14,009,220 42,186,747 2016 KRW 201,866,745 120,277,715 81,589,030 52,348,358 29,240,672 3,238,261 2,463,814 19.501 11,385,645 10,706,613 340,713,652 7.987,560 22,726,092 41.344,569 842.178 22.415,655 310,437 Earnings per share -Basic 299,868 157,967 -Diluted 299.868 157,967 The above consolidated statement of financial position should be read in conjunction with the accompanying notes Samsung Electronics Co., Ltd. and Subsidiaries CONSOLIDATED STATEMENTS OF COMPREHENSIVE INCOME 2017 2016 For the year ended December 31 299,868 157,967 Diluted The above consolidated statement of financial position should be read in conjunction with the accompanying notes. Samsung Electronics Co., Ltd. and Subsidiaries CONSOLIDATED STATEMENTS OF COMPREHENSIVE INCOME For the year ended December 31 2017 2016 (In millions of Korean wont) KRW KRW Profit for the period 42,186,747 22,726,092 Other comprehensive income (loss) Items not to be reclassified to profit or loss subsequently: Remeasurement of net defined bencfit liabilities, nct of tax 414,247 963,602 Shares of other comprehensive income (loss) of associates and joint ventures, net of tax (6,347) 50,438 Items to be reclassified to profit or loss subsequently: Changes in value of available-for-sale financial assets, net of tax $11.207 (23,839) Share of other comprehensive income (loss) of associates and joint ventures, net of tax (49,256) (130.337) Foreign currency translation, net of tax (6,334,987) 1,131,536 Gain (loss) on valuation of derivatives (37,121) Other comprehensive income (loss) for the period, net of tax (5,502,257) 1,991,400 Total comprehensive income for the period 36,684,490 24,717,492 Comprehensive income attributable to: Owners of the parent 35,887,505 24,310,814 Non-controlling interests 796,985 406,678 The above consolidated statement of financial position should be read in conjunction with the accompanying notes. Samsung Electronies Co., Ltd. and Subsidiaries CONSOLIDATED STATEMENTS OF CHANGES IN EQUITY Accumulated other comprehensive Income Equity attributable to attributable awes held. to owners for sale of the parent 23,797 172,876,767 22,415,655 Non controlling Interests Total 6,183,038 179,059,805 310,437 22,726,092 1 (23.797) (111,503) 87.664 (23.839) 212 (79.934) 1,160,316 35 (28,780) (79,899) 1.131,536 9266280 37.322 963,602 Other Preference Ordinary Share Retained Components In million of Korean Won shares shares premium earning of equity Balance as at January 1, 2016 119,467 778,047 4,403,893 185,132,014 (17,580,451) Profit for the period 22,415,655 Changes in value of available for sale financial assets, net of tax (87,706) Share of other comprehensive income Closs) of associates and joint ventures net of tax (80.146) Foreign currency translation, net of tax 1.160.316 Remeasurement of net defined benefit liabilities, net of tax 926,280 Classified as held for sale 29,022 Total comprehensive Income (lows) 22,415,655 1,947,766 Dividends (3,061.361) Capital transaction under common control (37) Changes in consolidated entities Acquisition of treasury stock (1707.938) Retirement of treasury stock (11.399,991), 11.190.991 Others 6.083 Total transactions with owners - (14,461,352) 3,698,099 Balance as at December 31, 2016 119.467 778,047 4,103,893 193,086317 (1.94.586) Profit for the period 411344.56 Changes in value of available-for-sale financial assets, net of tax 489,150 Share of other comprehensive income floss) of associates and joint ventures net of (54.300) Foreign currency translation, net of tax 16.289.926) (29.022) (52,607) III 24,310,814 (3.061.361) (37) 406,678 24,717,492 (65.161) (3.126,522) 12.272 12,235 1.790 1.790 (7.707,938) (7.707.938) 6.083 88 6,171 (28,810) (10,763.253) 186,424,328 41.344.560 (51,011) (10,814.264) 6,538,705 192,963,033 842.178 42,186,747 489.150 22.057 S11.207 154.300) (6.261,115) 28.10 1.303) (55,603) (73.8713 6.334.987) 778,047 4,403,893 193,086,317 (11,934,586) 41,344.569 (28,810) 186,424,328 41,344,569 6,538,705 192,963,033 842,178 42,186,747 489,150 489,150 22,057 311,207 (54.300) (6,289.926) (54,300) (6,261,116) D 28,810 (1.303) (55,603) (73,871) (6334,987) Balance as at December 31, 2016 119,467 Profit for the period Changes in value of available for sale financial assets, net of tax Share of other comprehensive income (loss) of associates and joint ventures, net of tax Foreign currency translation, net of tax Remeasurement of net defined benefit liabilities, net of tax Gain (loss) on valuation of derivatives Total comprehensive income (loss) Dividends Capital transaction under common control Changes in consolidated entities Acquisition of treasury stock Retirement of treasury stock Others Total transactions with owners Balance as at December 31, 2017 119,467 28,810 406,323 (37,121) 41,344,569 (5,485,874) (6.747,123) (2.992) (2,699) (8,350424) (11.872.563) 11,872,563 4.821 (18,619,686) 3,521,269 778,047 4.403,893 215,811,200 (13,899,191) 406,323 (37,121) 35,887,505 (6.747,123) (2.992) (2.699) (8.350,424) 7.924 414,247 (37,121) 796,985 36,684,490 (64,277) (6,811400) 15.114 12,122 (9.352) (12.051) (8.350,424) LLLL 4,821 837 5,658 (15.098,417) (57,678) (15,156,095) 207,213416 7,278,012 214.491,428 The above consolidated statement of financial position should be read in conjunction with the accompanying notes Samsung Electronics Co., Ltd. and Subsidiaries CONSOLIDATED STATEMENTS OF CASH FLOWS 2017 2016 KRW KRW 42,186,747 36,211,232 (10,620,547) 67,777,432 1.581,117 (542,715) 173,305 (6,827.098) 62,162,041 22.726,092 30,754,471 (1.180,953) 52,299,610 1,405,085 (443,838) 256,851 (6,132,066) 47,385,644 387.627 499.856 For the year ended December 31 (In millions of Korean won) Cash flows from operating activities Profit for the period Adjustments Changes in assets and liabilities arising from operating activities Cash generated from operations Interest received Interest paid Dividends received Income tax paid Net cash inflow from operating activities Cash flows from investing activities Net decrease increase) in short-term financial instruments Disposal of short-term available for sale financial assets Acquisition of short-term available for sale financial assets Disposal of long-term financial instruments Acquisition of long-term financial instruments Disposal of long-term available-for-sale financial assets Acquisition of long-term available for sale financial assets Acquisition of held-to-maturity financial assets Disposal of investment in associates and joint ventures Acquisition of investment in associates and joint ventures Disposal of property, plant and equipment Acquisition of property, plant and equipment Disposal of intangible assets Acquisition of intangible assets Cash outflow from business combinations Cash inflow from business transfers Others Net cash outflow from investing activities Park (6,780,610) 3,010,003 2,129.551) 789,862 (1.741.547) 2,010,356 (1.498,148) 1.750.221 (1.079.355) 191.826 (358.497) (106,751) 355.926 (25.293) 308.354 (42.792.24) 2.280.203 184.306) 270.874 (24.142.973) 6,944 (1.047.) (632.050) 733 1983.740) 18.754.268 1,248.834 28.4353 (49.385.216) 19.036 (29,658.675) E ## ENG Disposal of property, plant and equipment 308,354 270,874 Acquisition of property, plant and equipment (42,792,234) (24,142,973) Disposal of intangible assets 733 6.944 Acquisition of intangible assets (983,740) (1,047,668) Cash outflow from business combinations (8,754,268) (622,050) Cash inflow from business transfers 1,248,834 Others (28,455) 19,936 Net cash outflow from investing activities (49,385,216) (29,658,675) Cash flows from financing activities Net increase in short-term borrowings 2,730,676 1.351,037 Acquisition of treasury stock (8,350,424) (7.707.938) Proceeds from long-term borrowings and debentures 998,311 1.041.743 Repayment of long-term borrowings and debentures (1.140,803) (252,846) Dividends paid (6,804,297) (3,114,742) Net increase in non-controlling interests 5,670 13,232 Net cash outflow from financing activities (12,560,867) (8,669,514) Effect of exchange rate changes on cash and cash equivalents (1,782,270) 417,243 Net (decrease) increase in cash and cash equivalents (1,566,312) 9,474,698 Cash and cash equivalents Beginning of the period 32,111,442 22,636,744 End of the period 30,545,130 32,111,442 The above consolidated statements of cash flows should be read in conjunction with the accompanying notes