

Question: Need help with screenshots 1 through 8 (one through 8). Note: Screenshot 6 (six) includes two photographs because I could not fit both the prompt
Need help with screenshots 1 through 8 (one through 8). Note: Screenshot 6 (six) includes two photographs because I could not fit both the prompt and graphs in one screenshot. Please number your solutions as I have. Also, I do not need any explanations, as I only require the "end-product." If you have any other questions, do not hesitate to let me know by commenting below. Thanks.
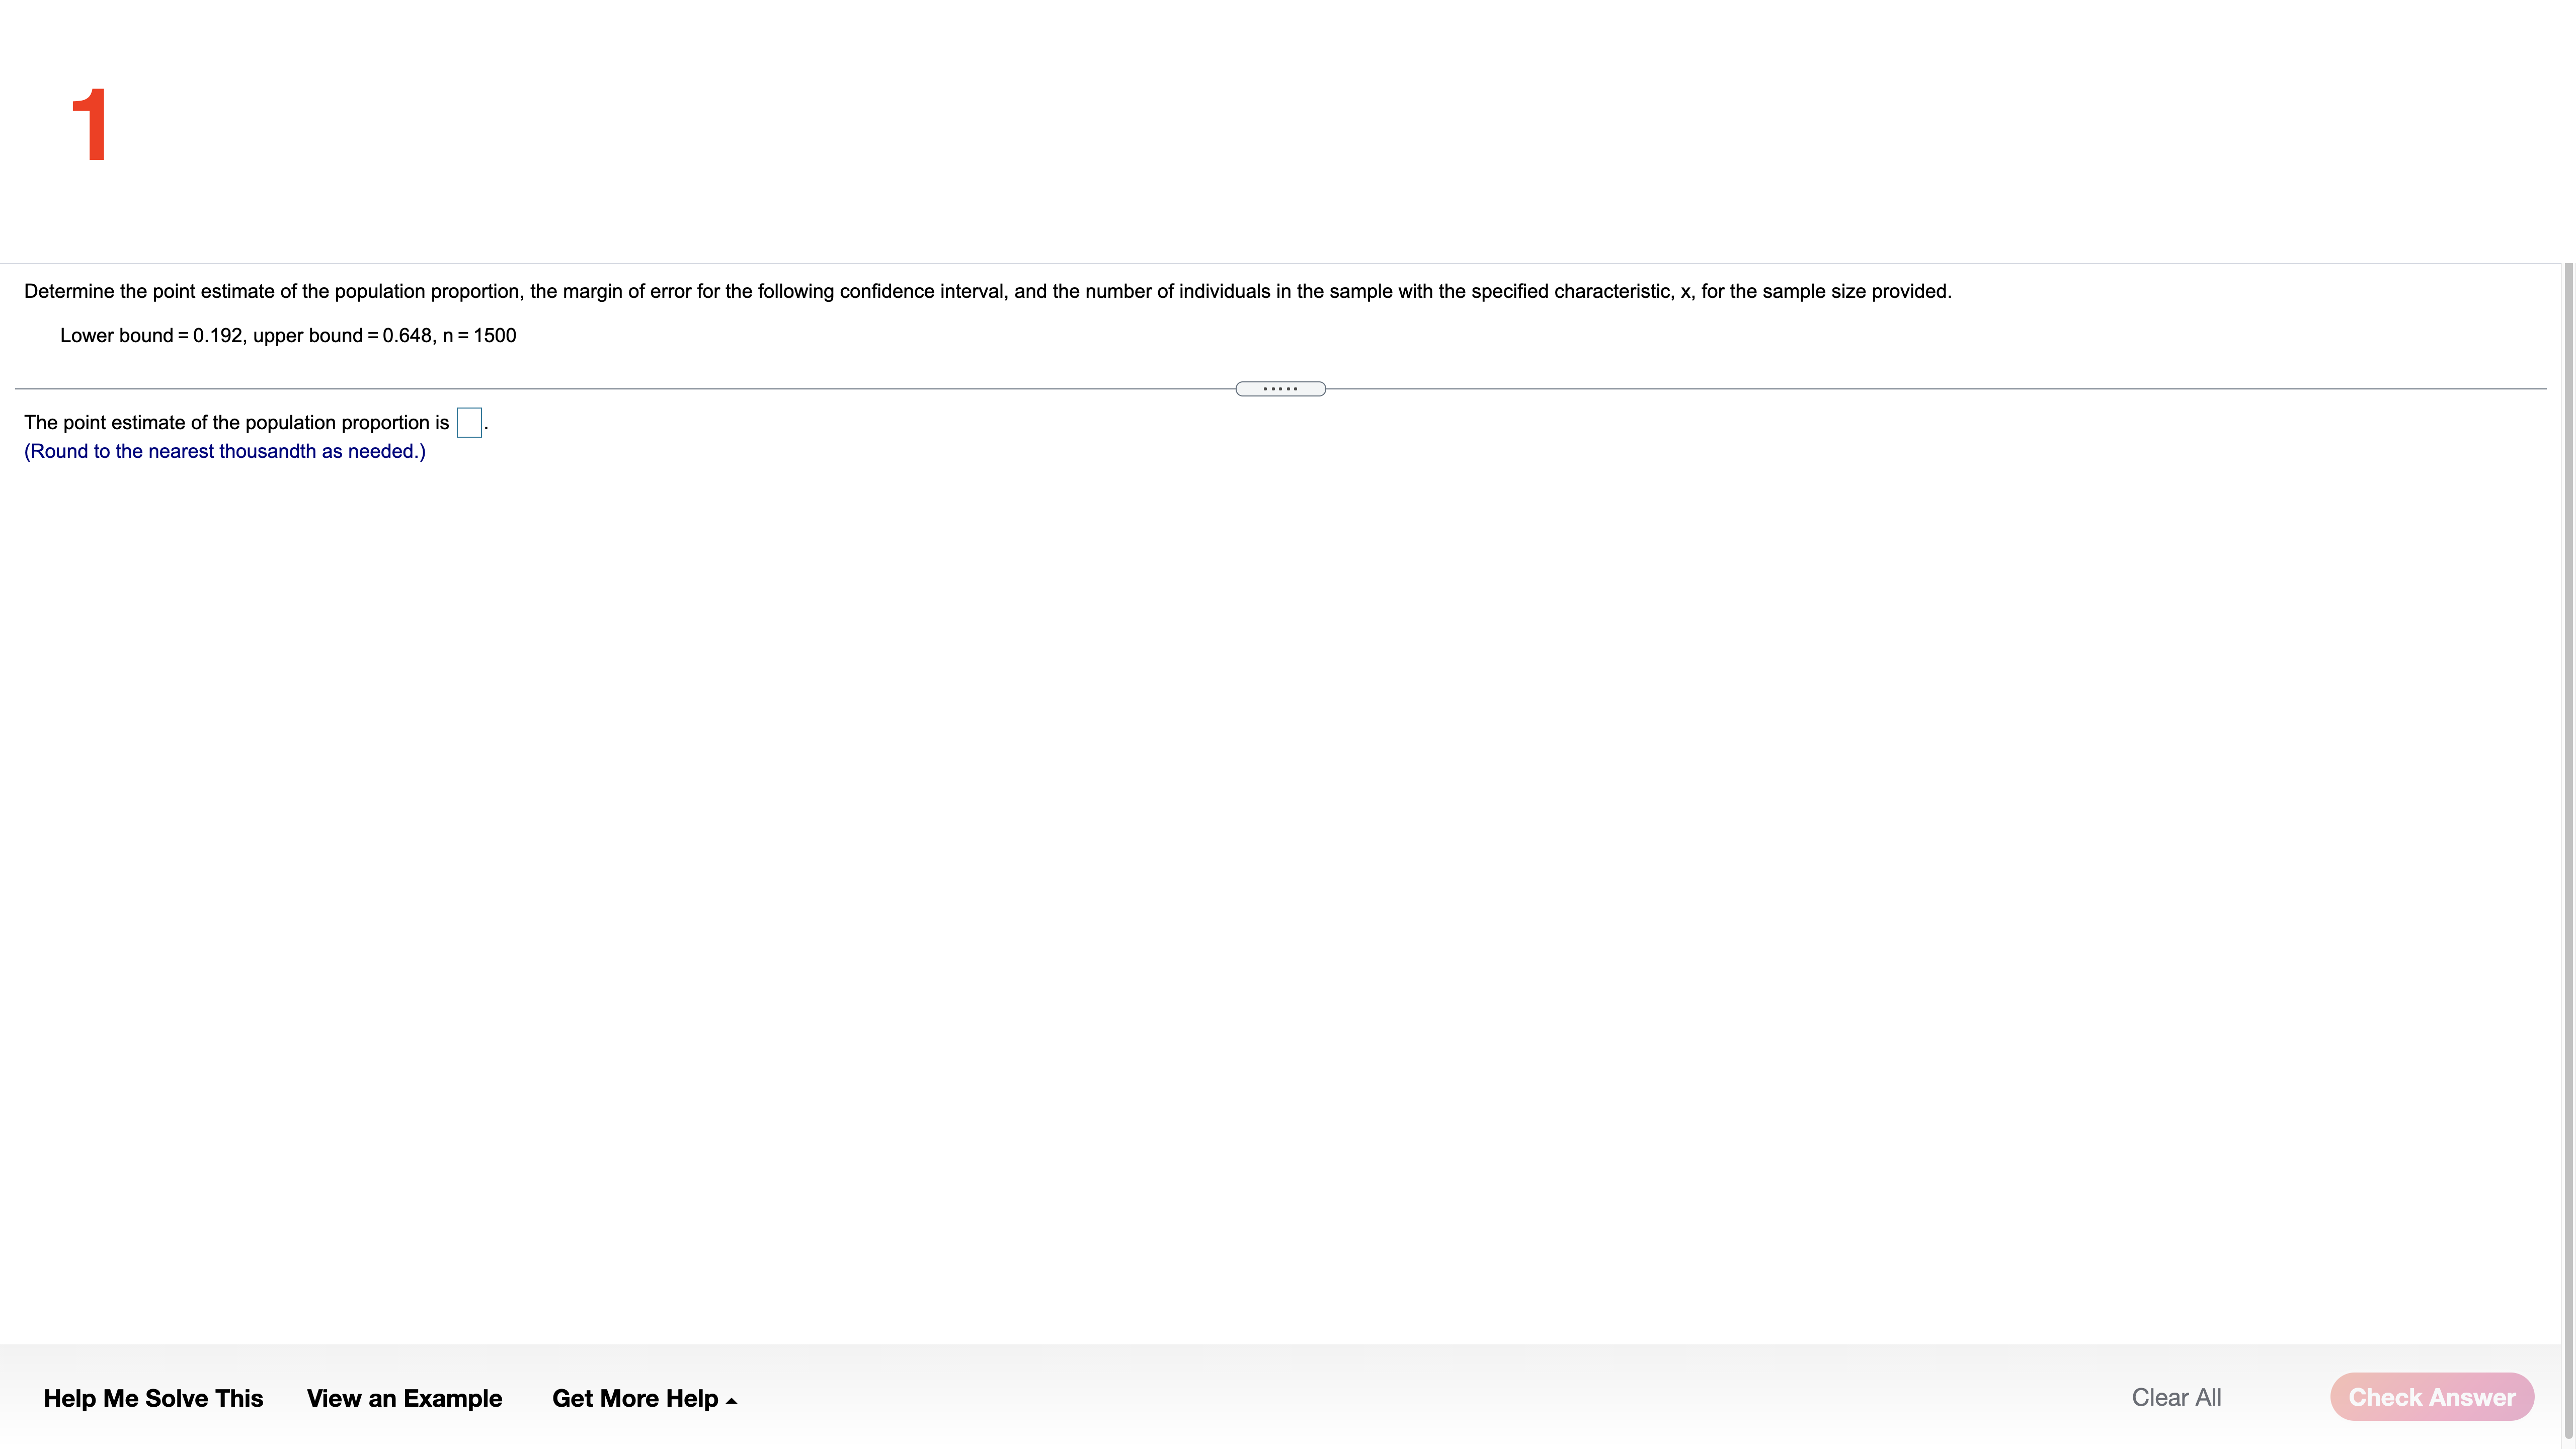
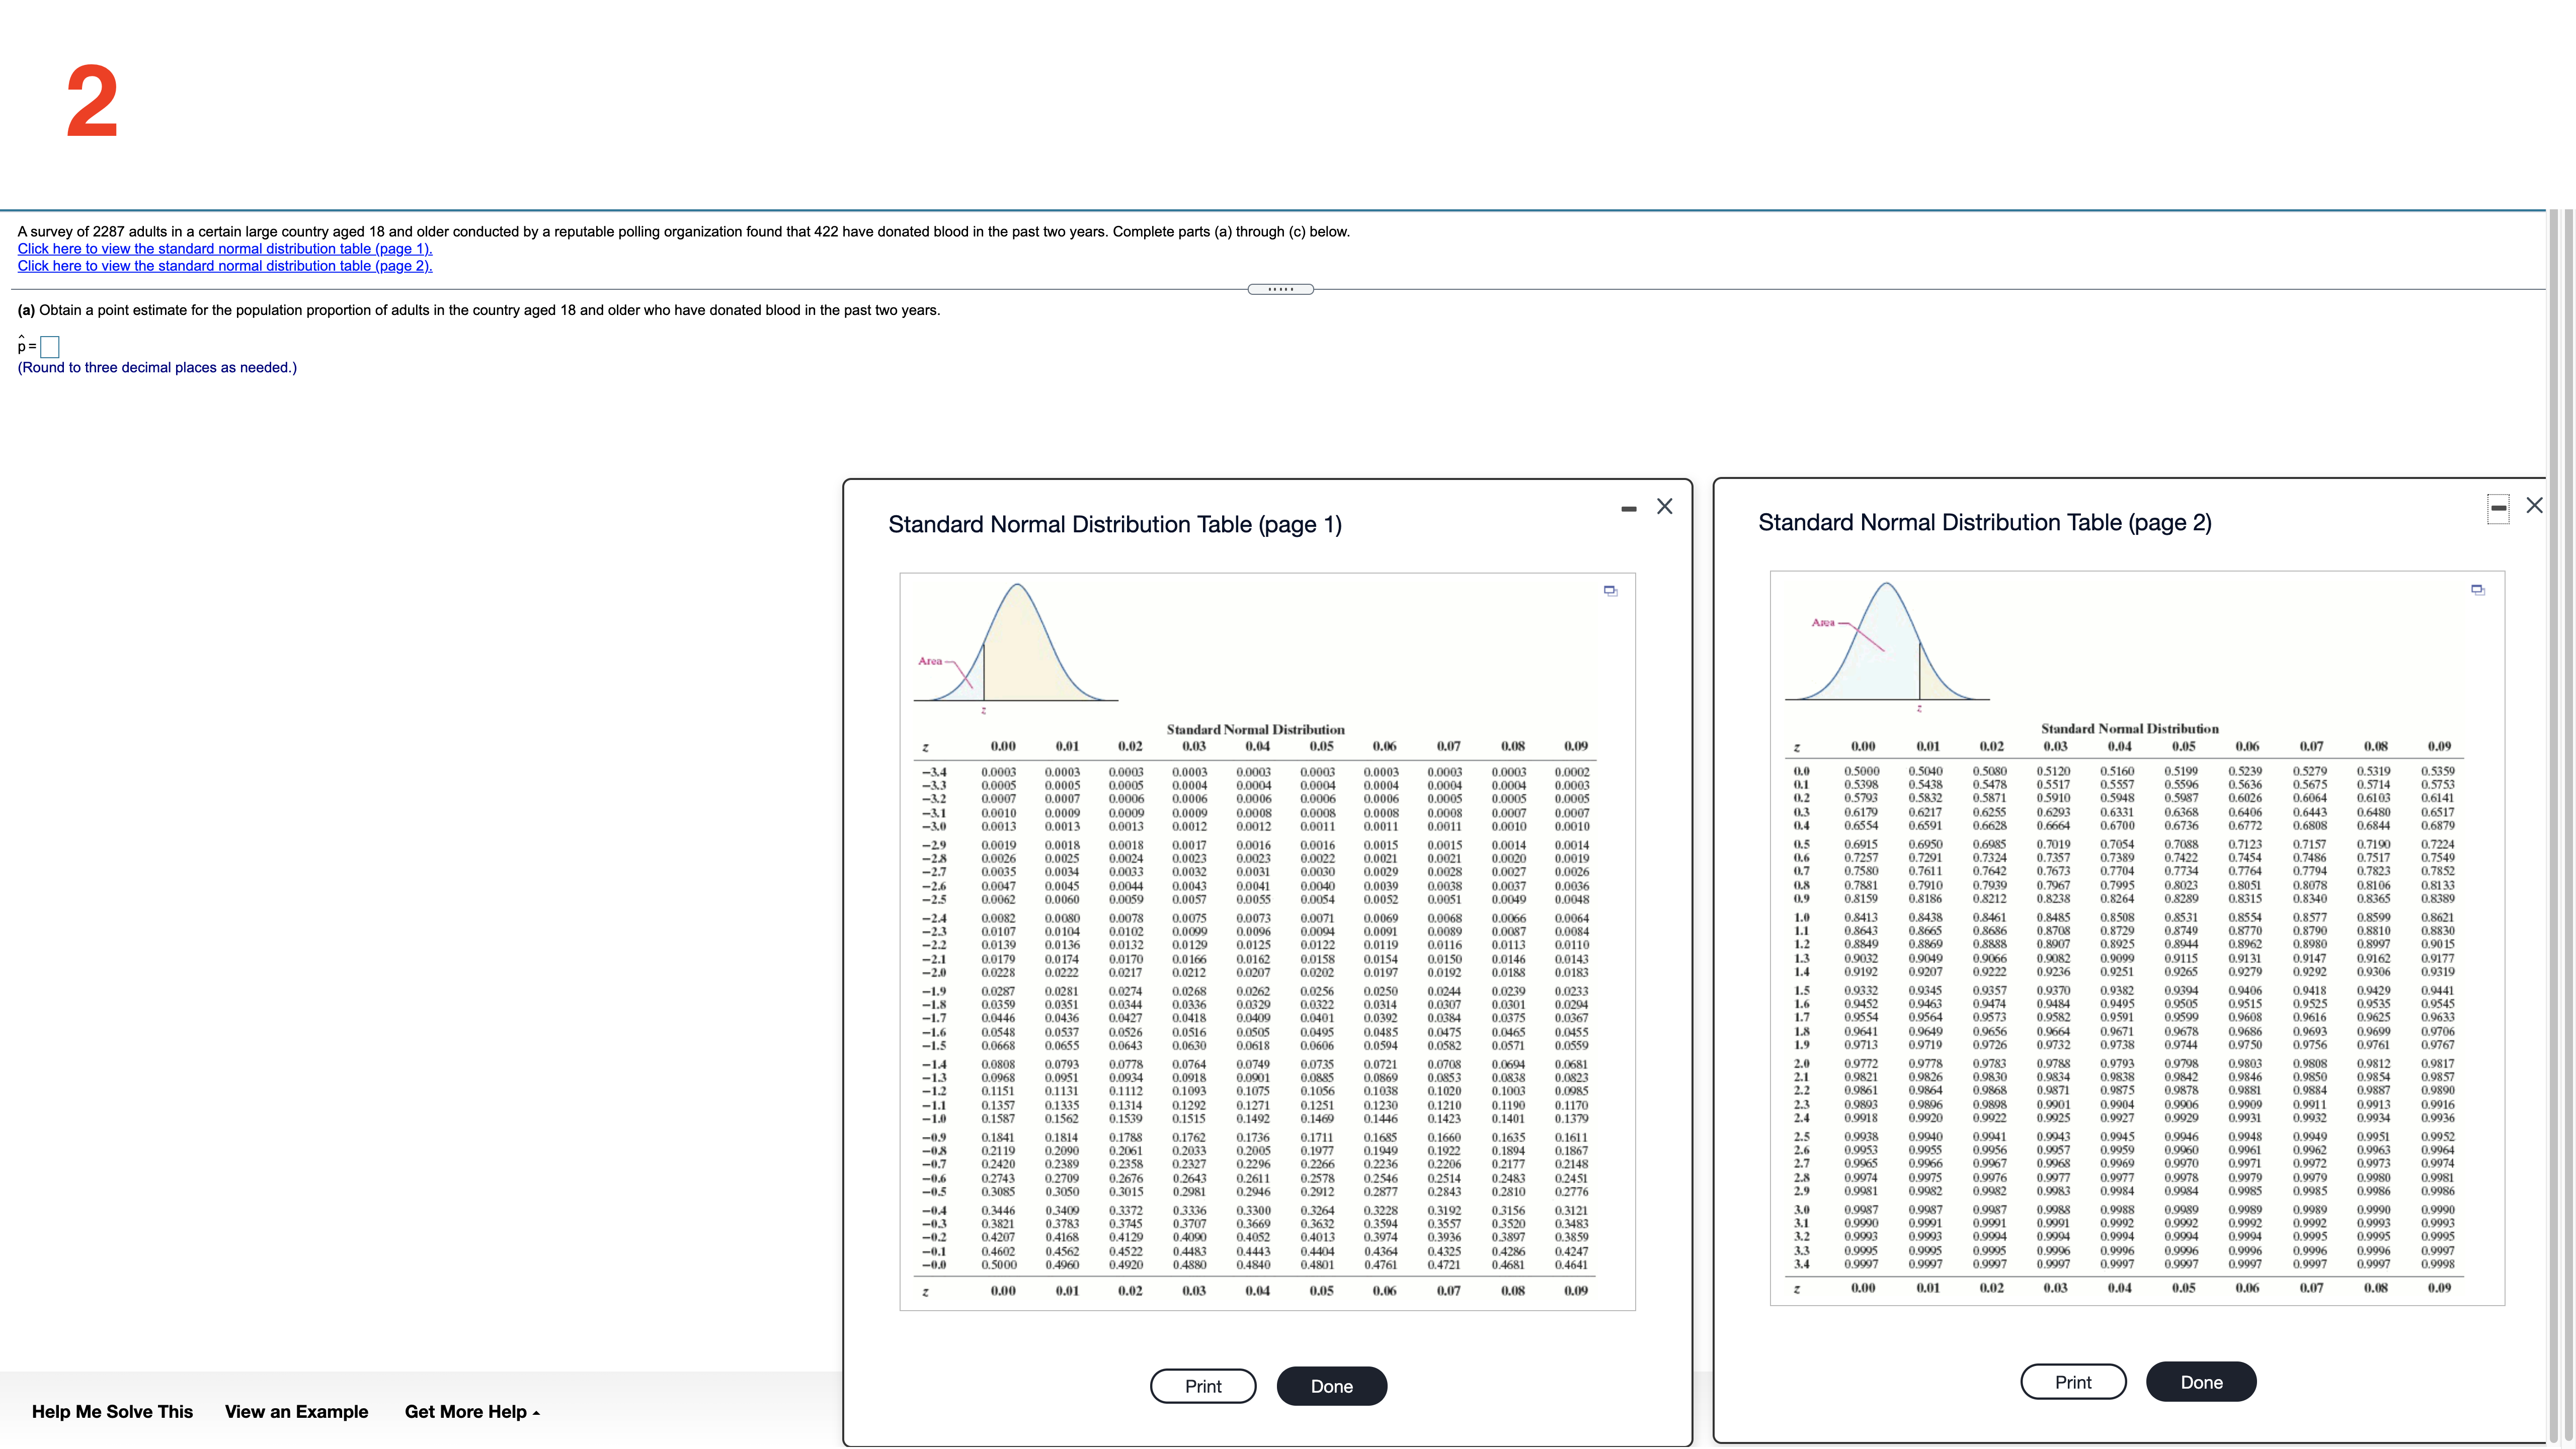
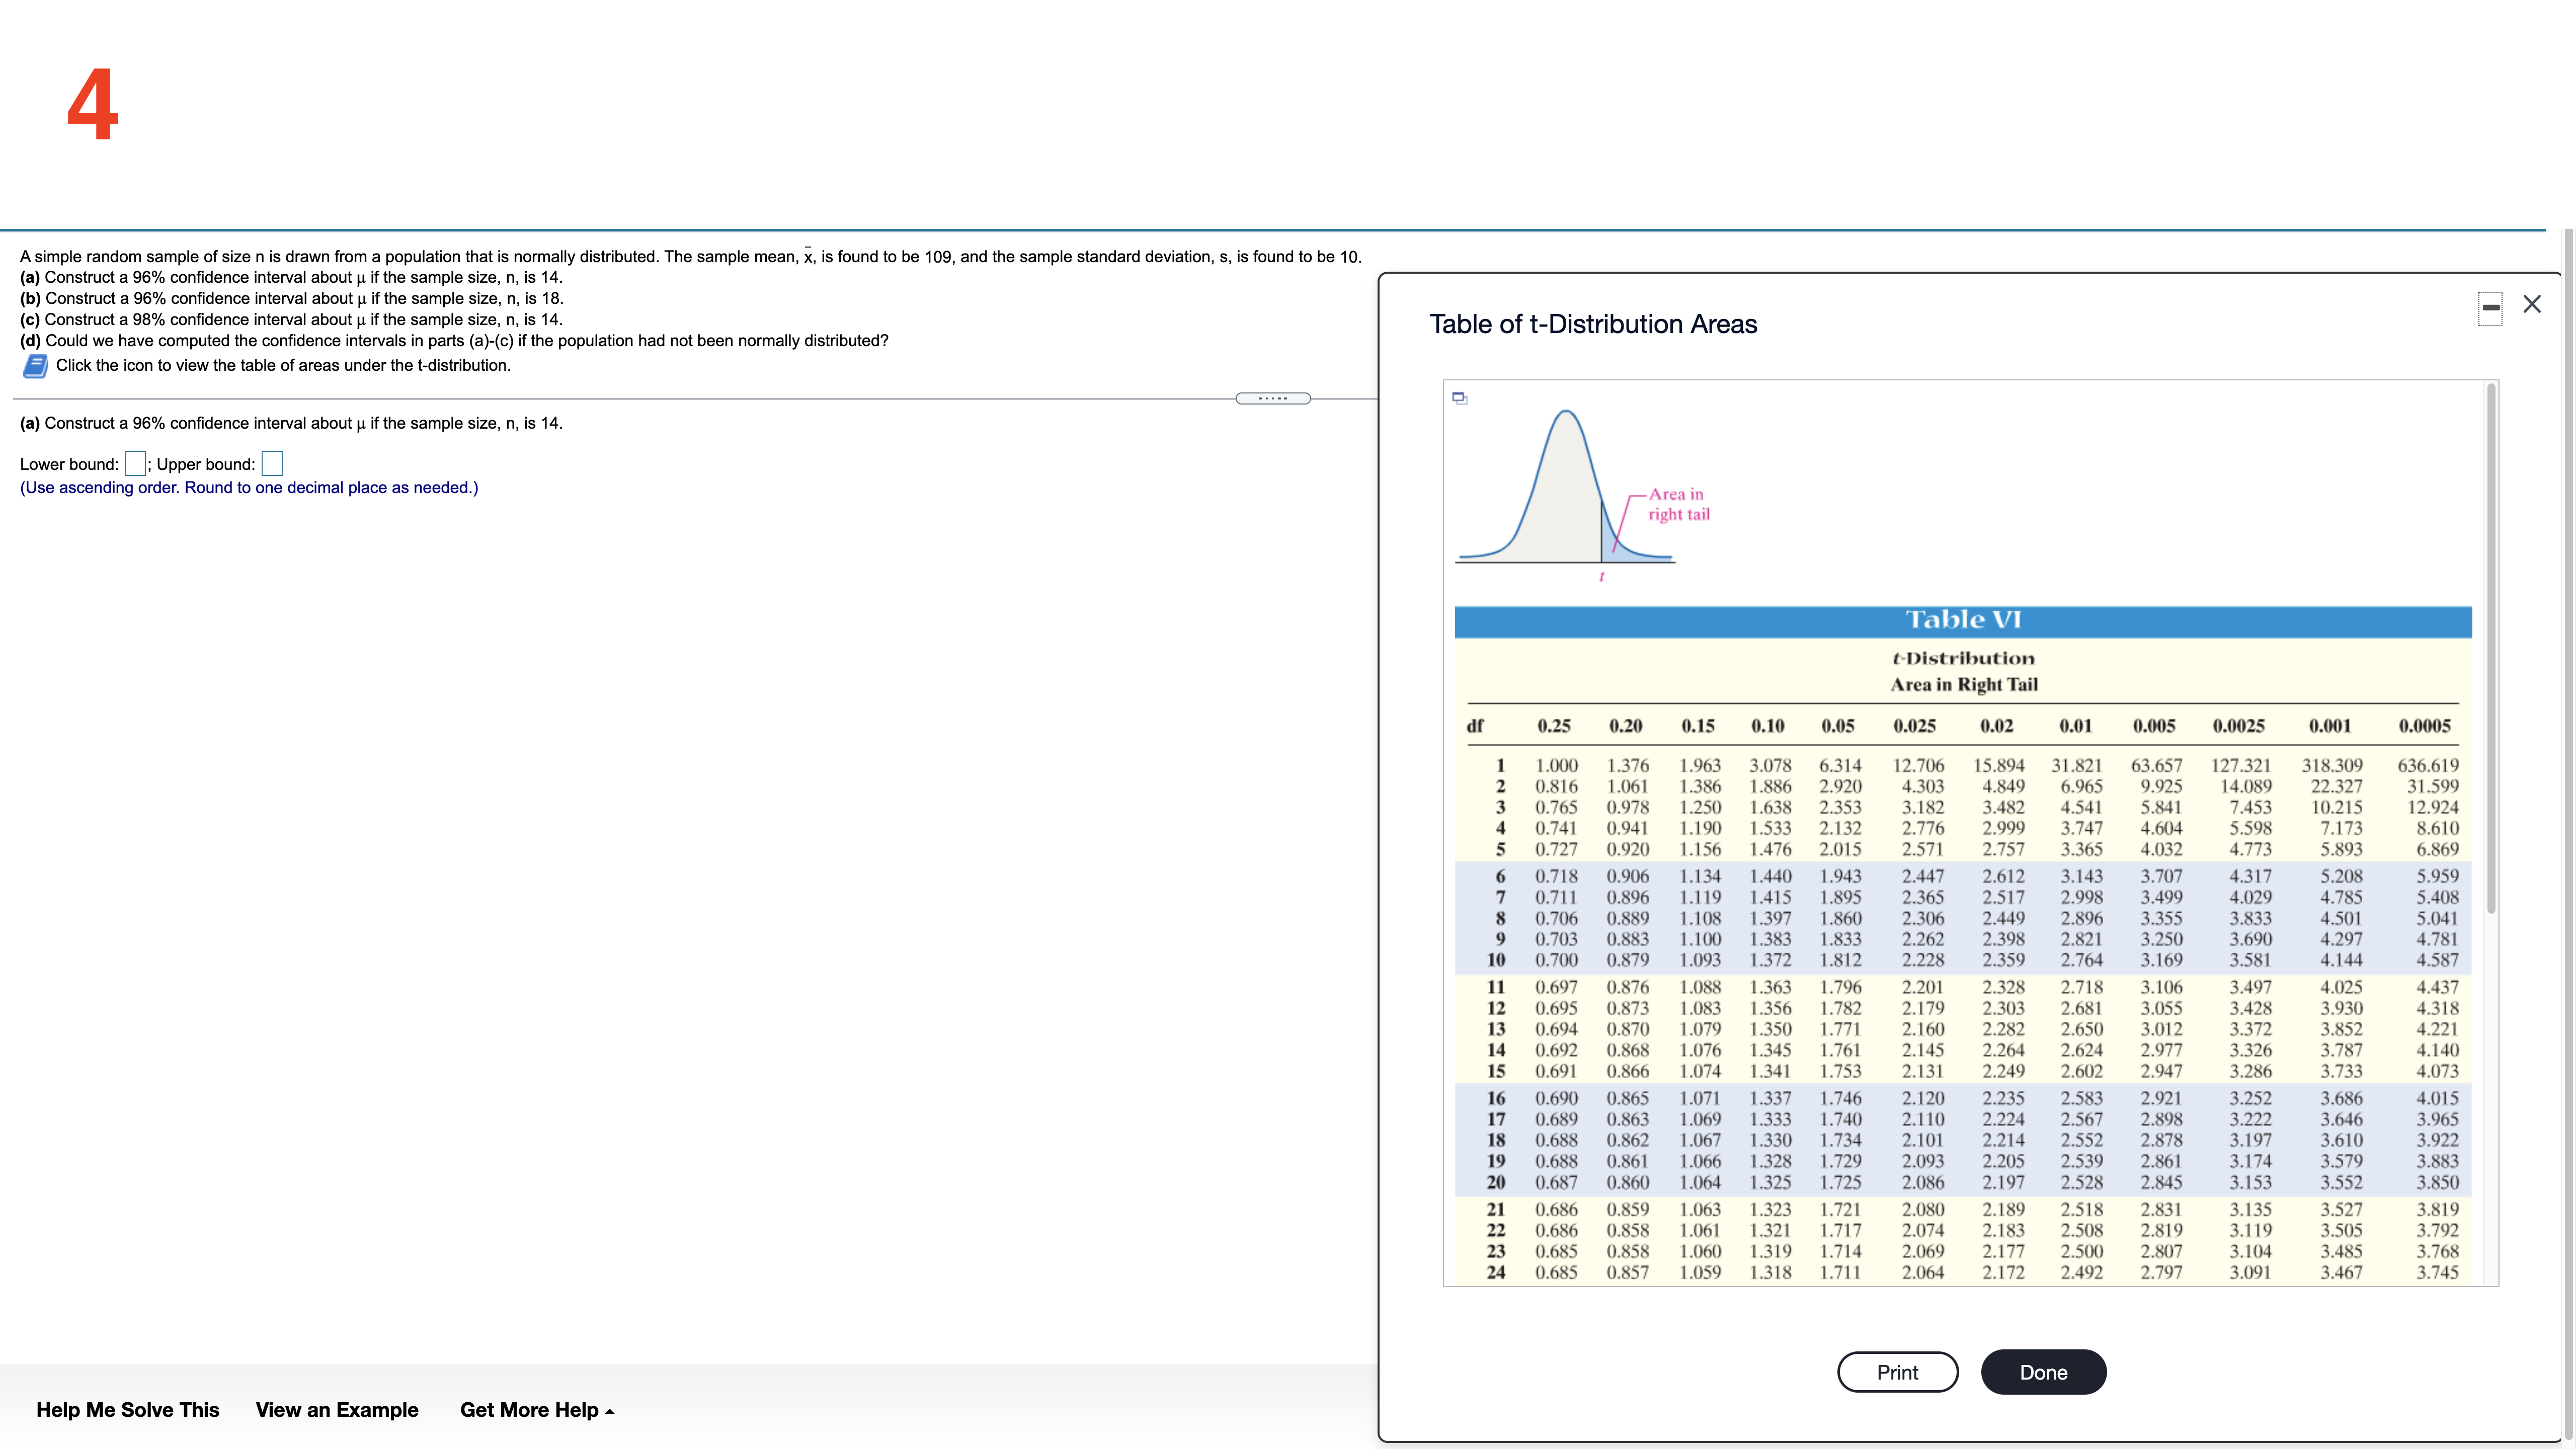
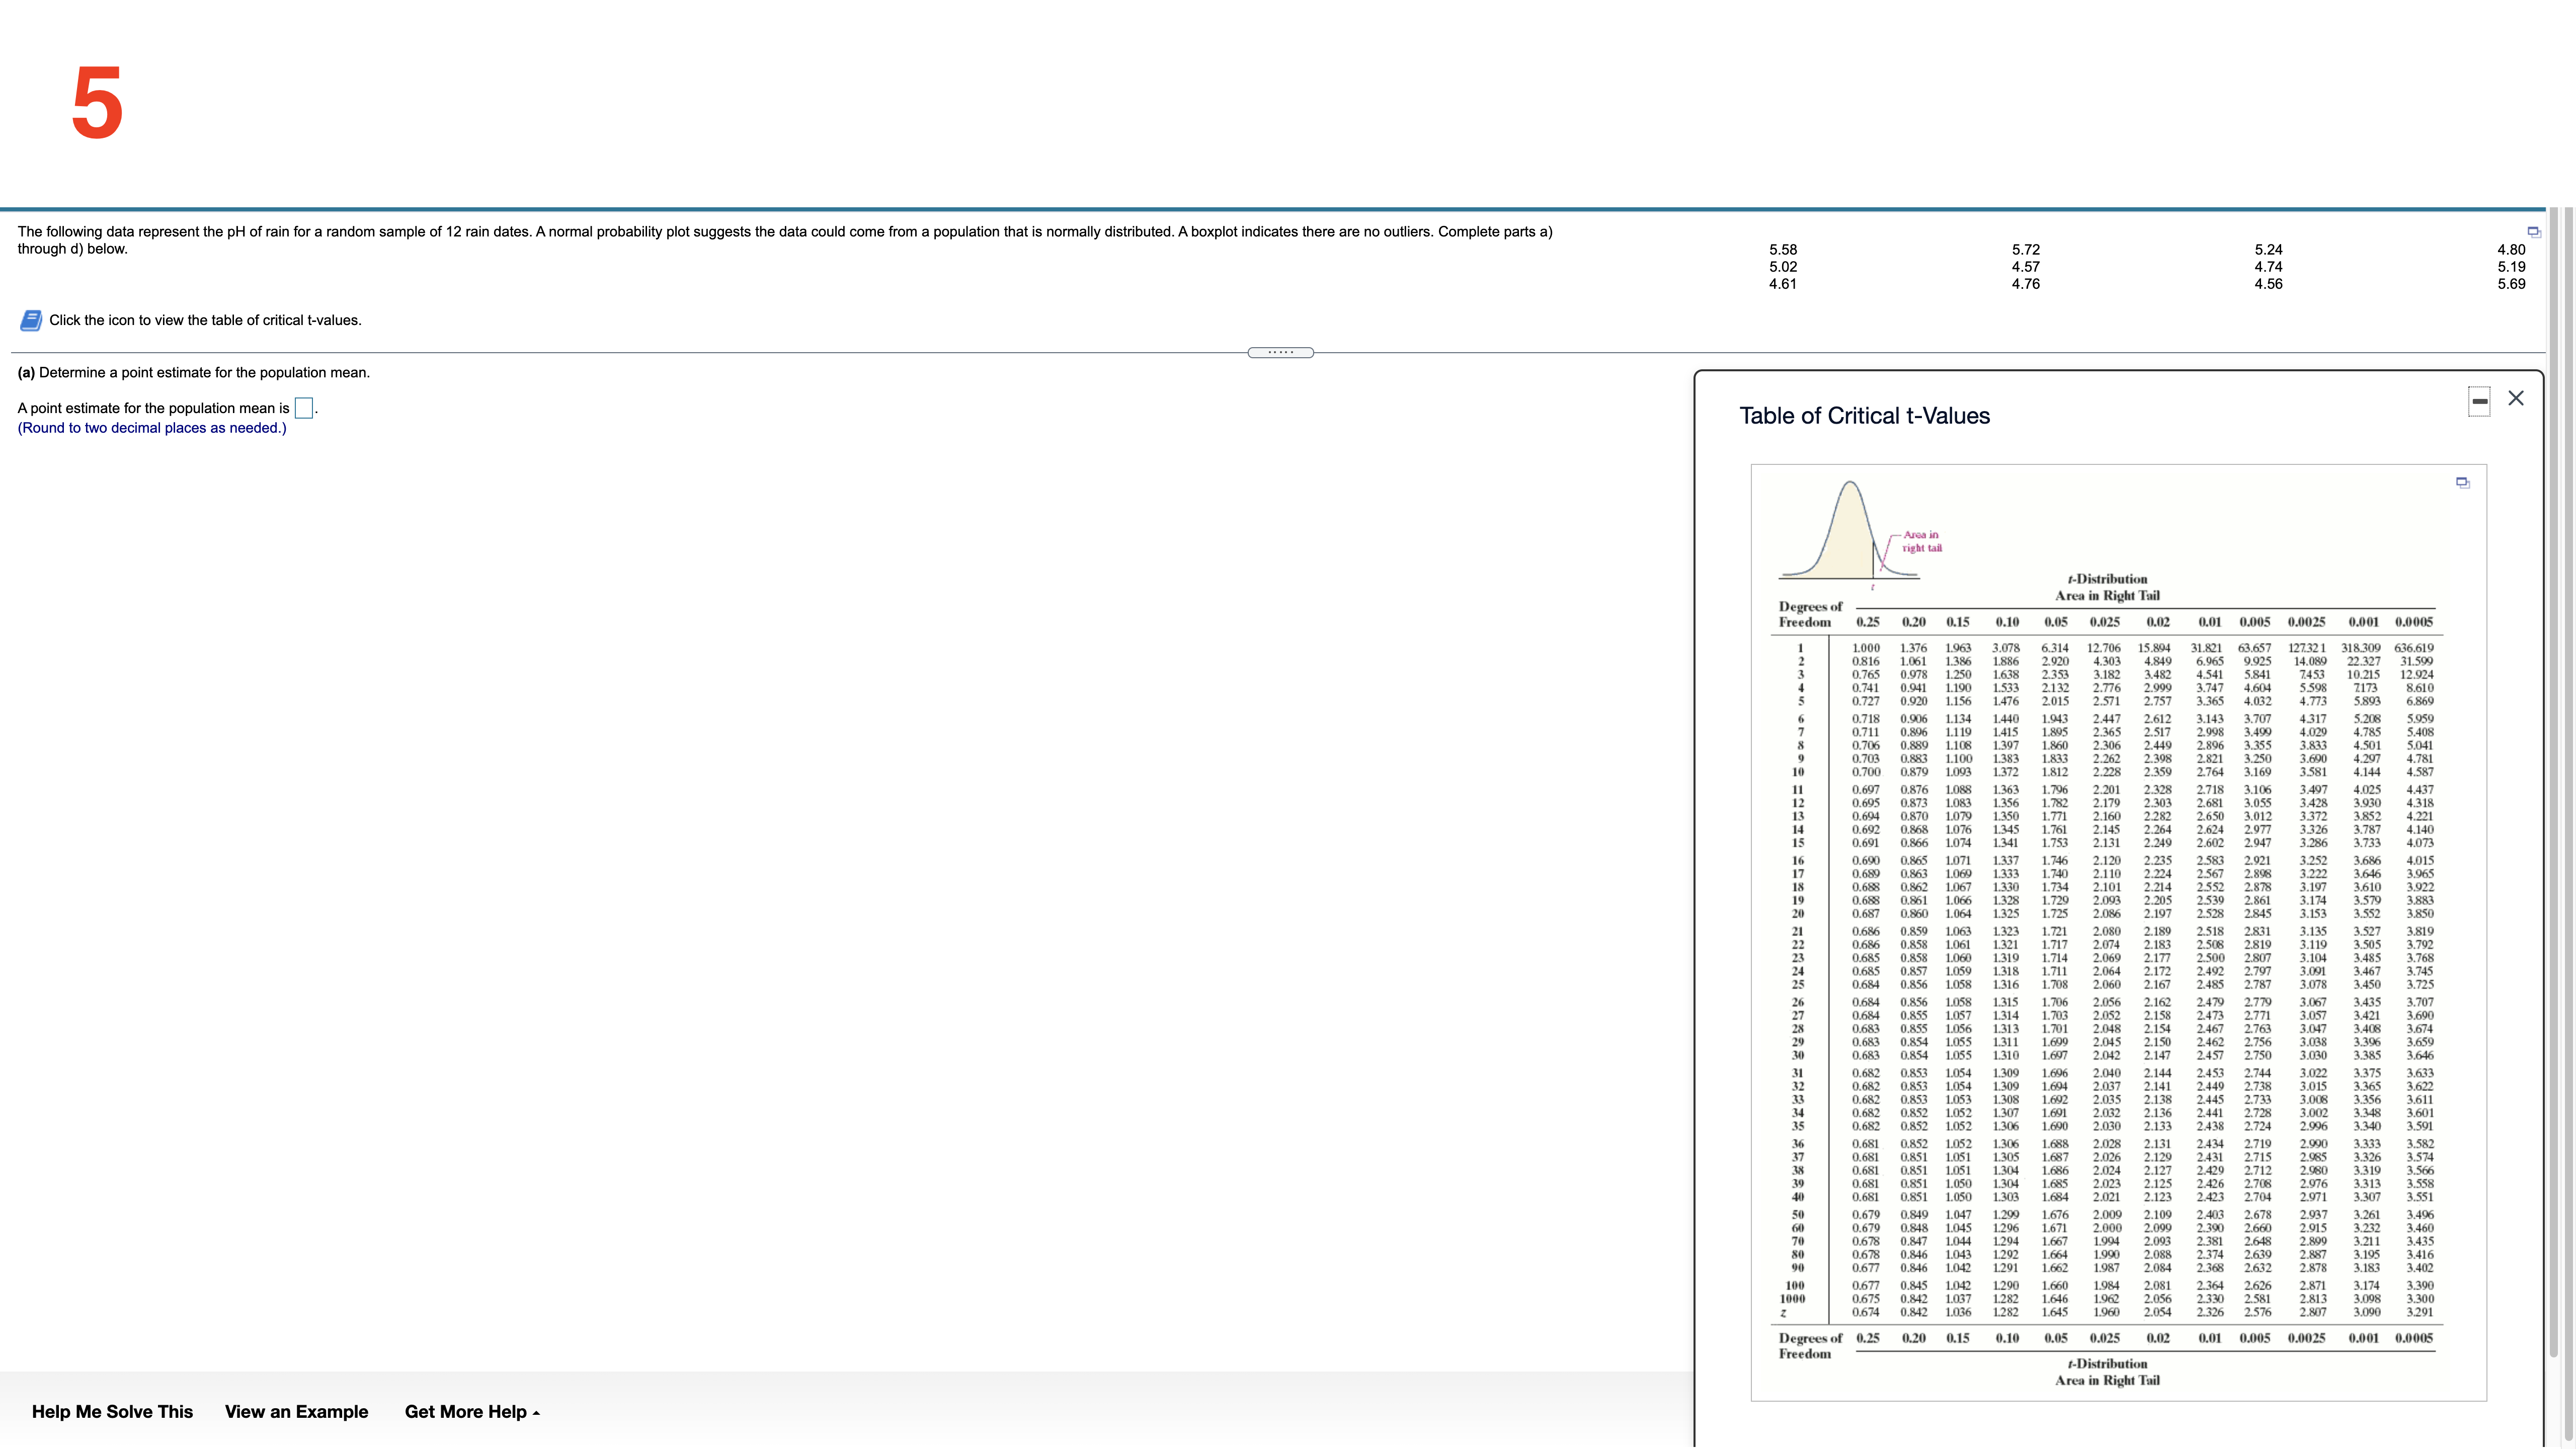
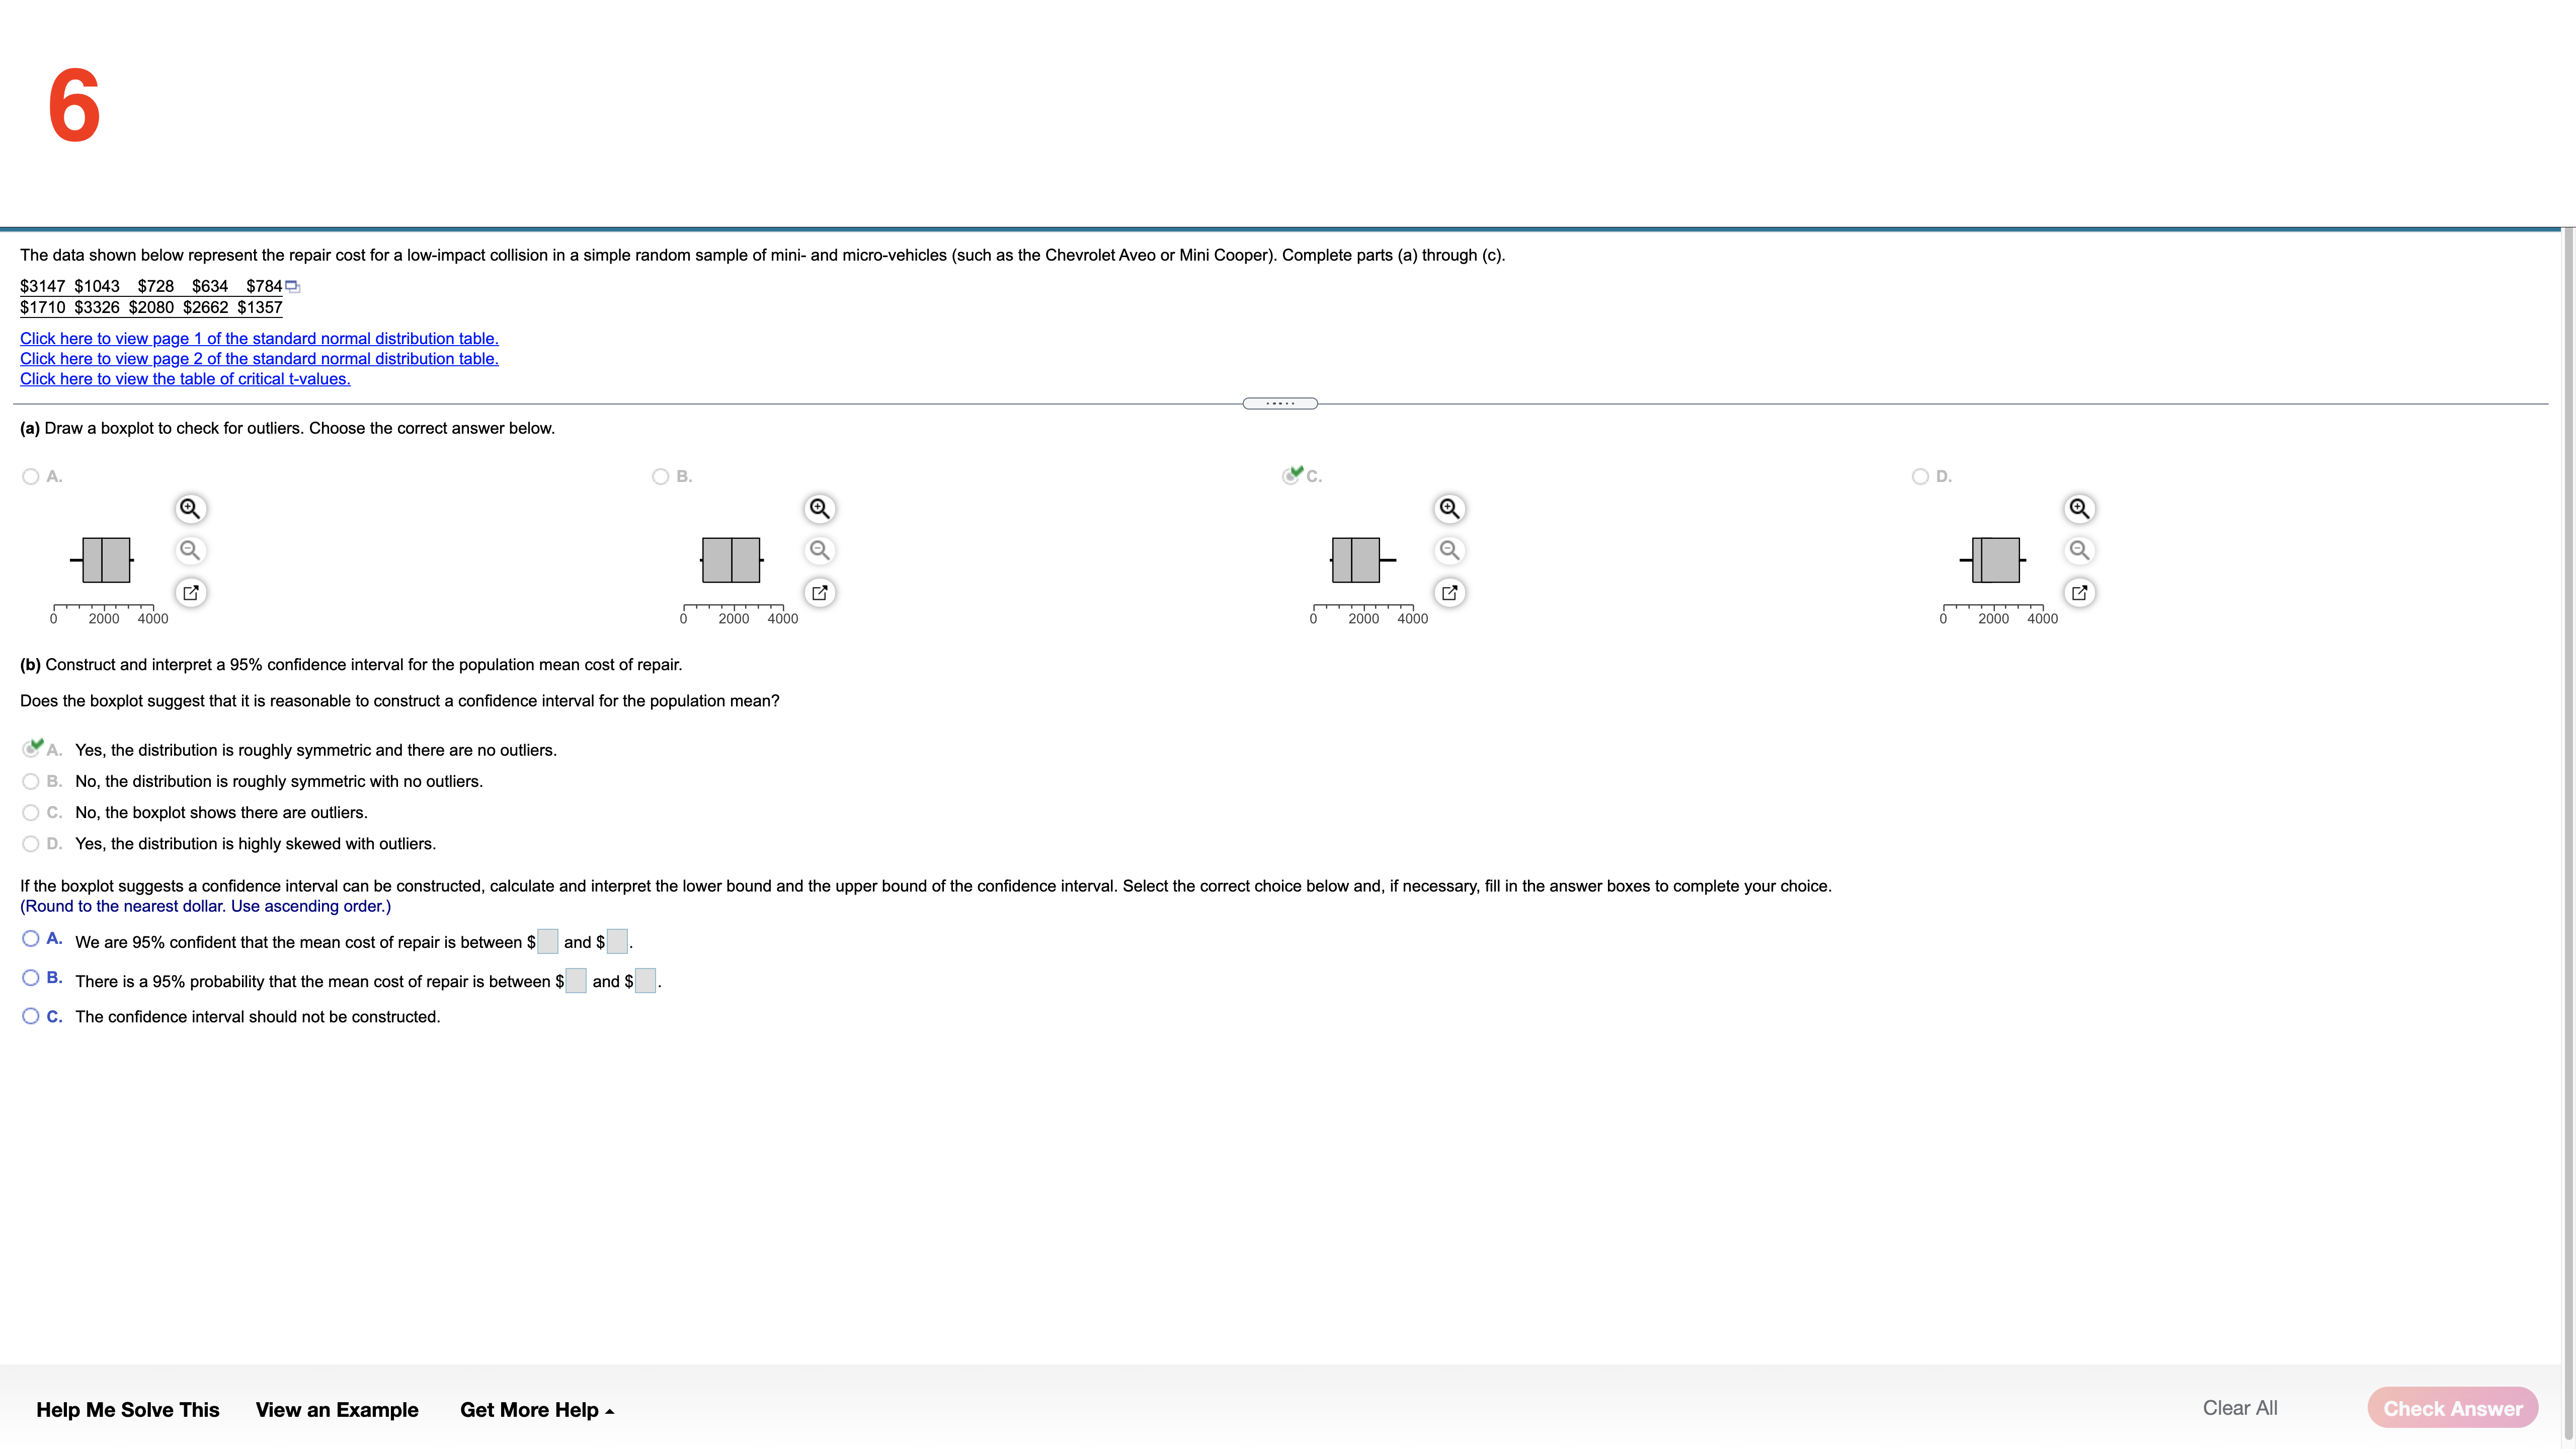
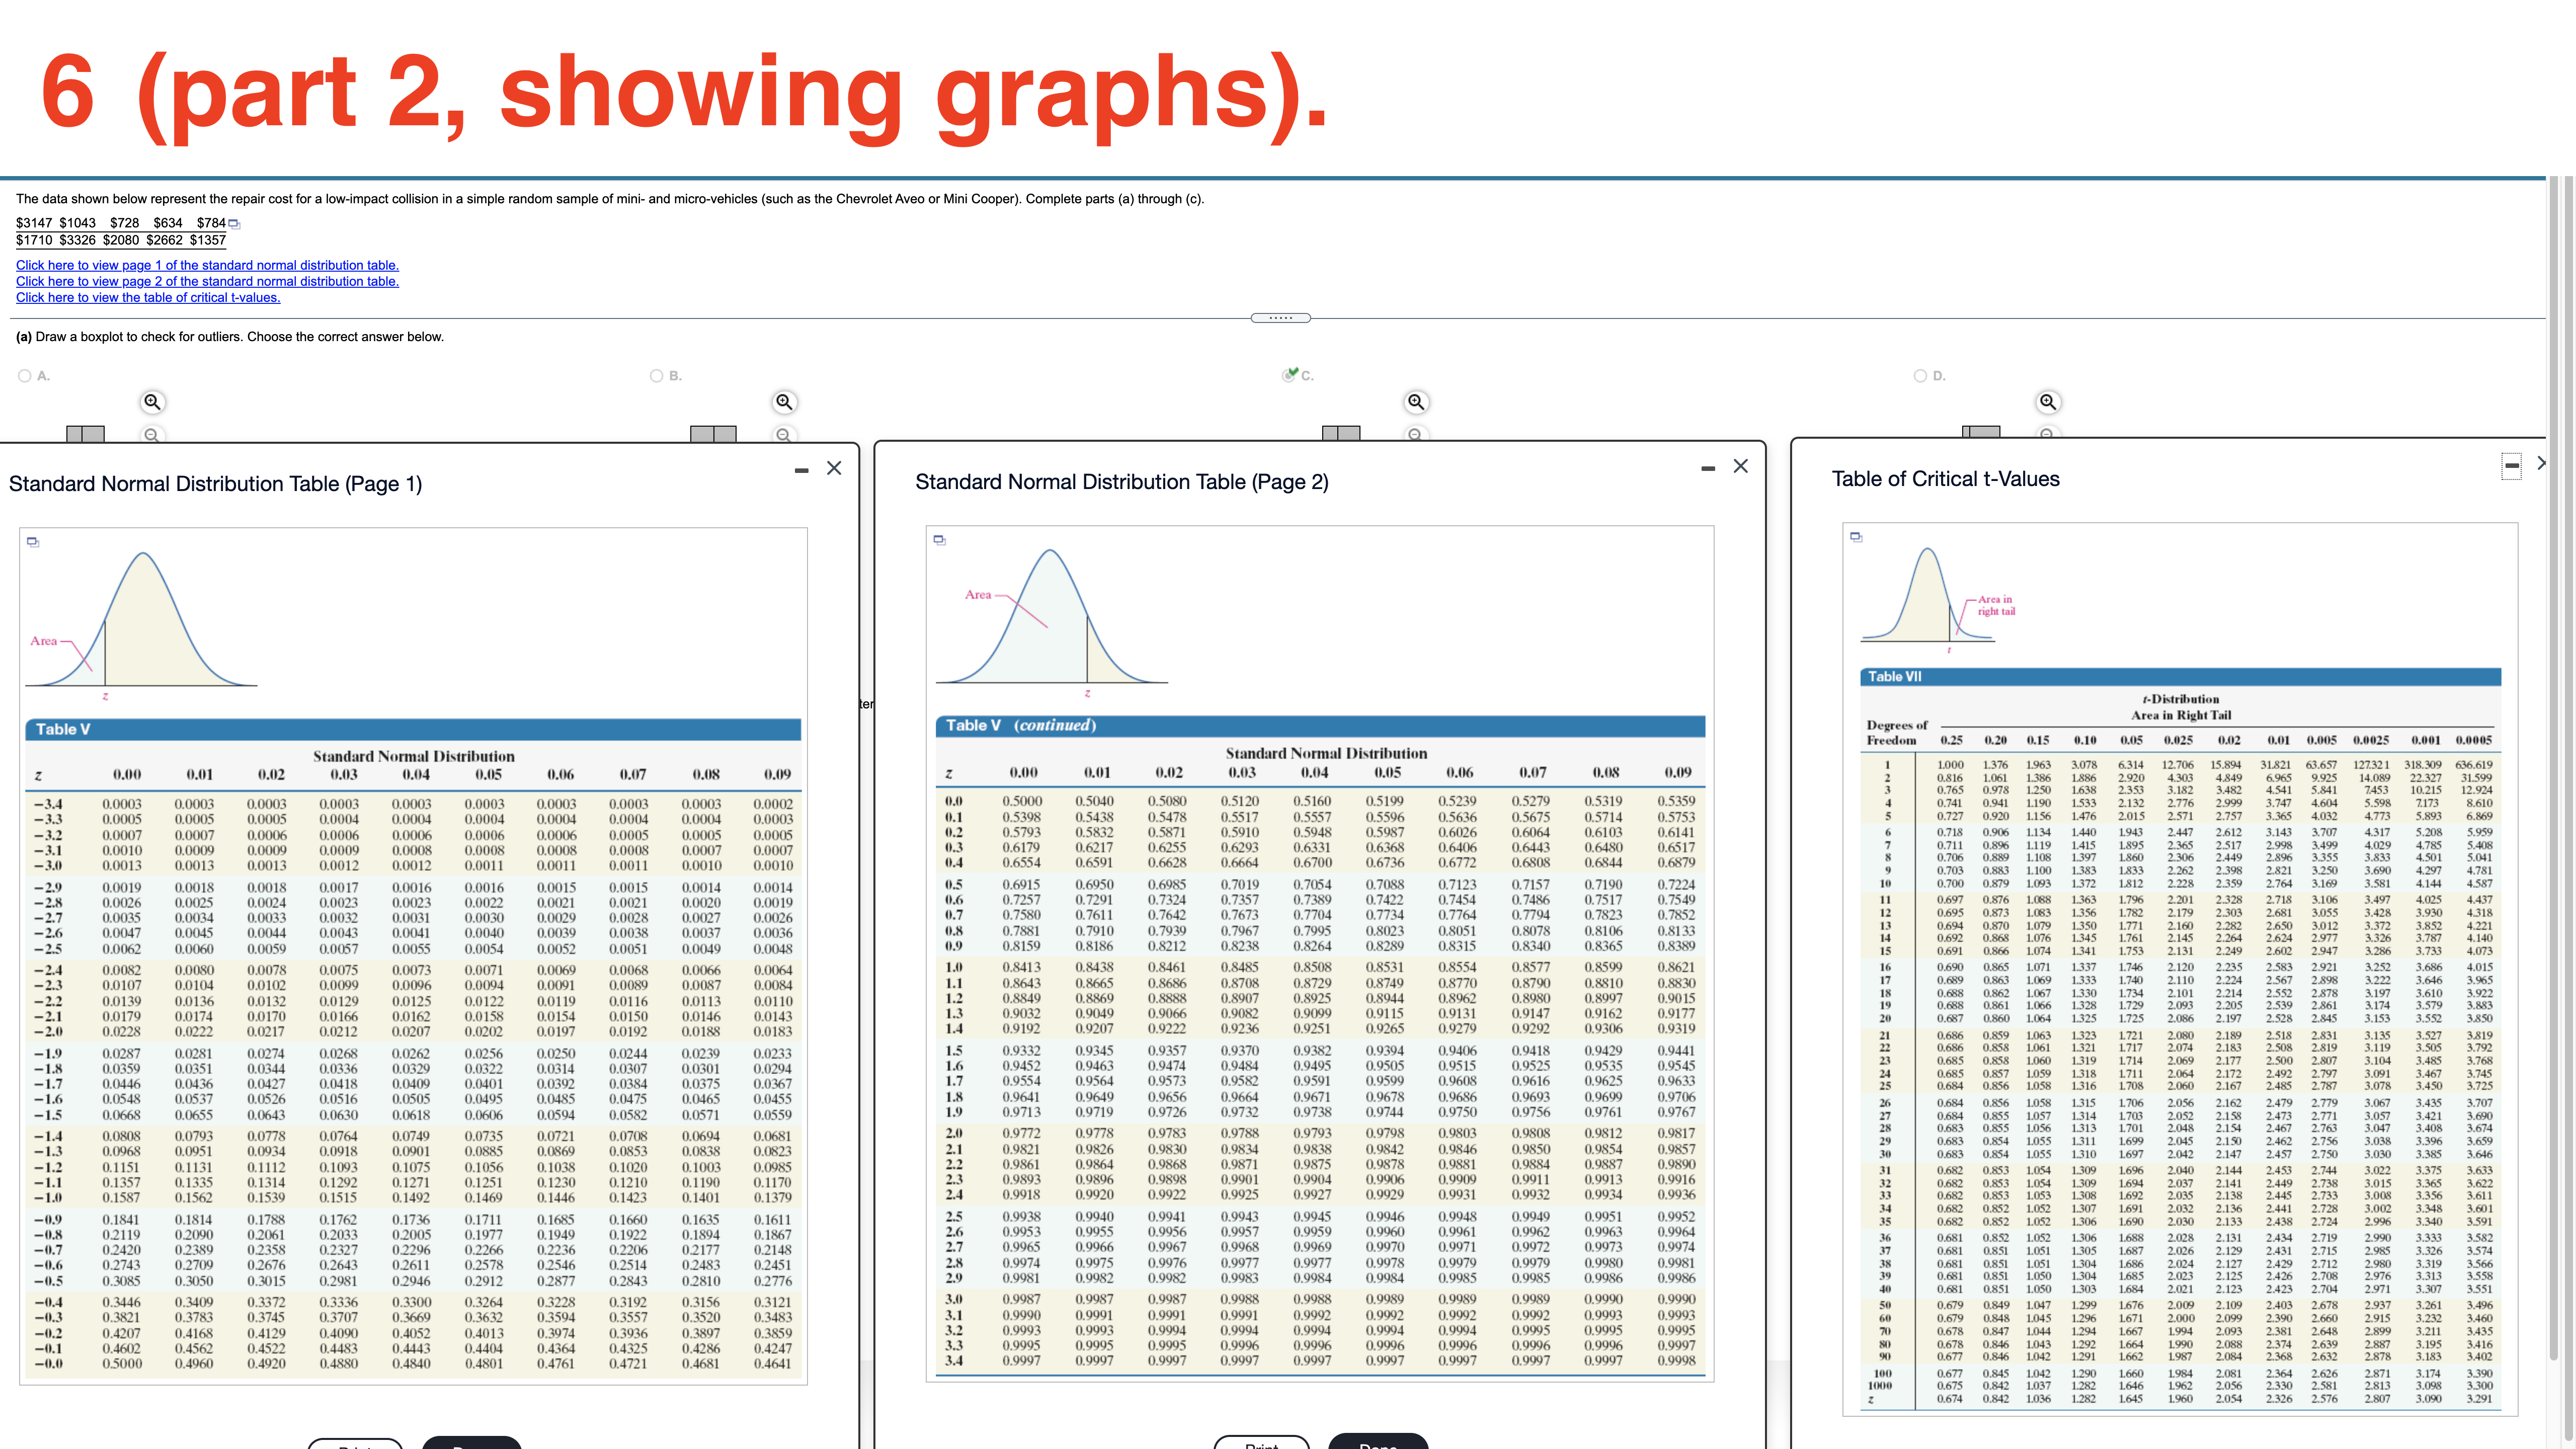
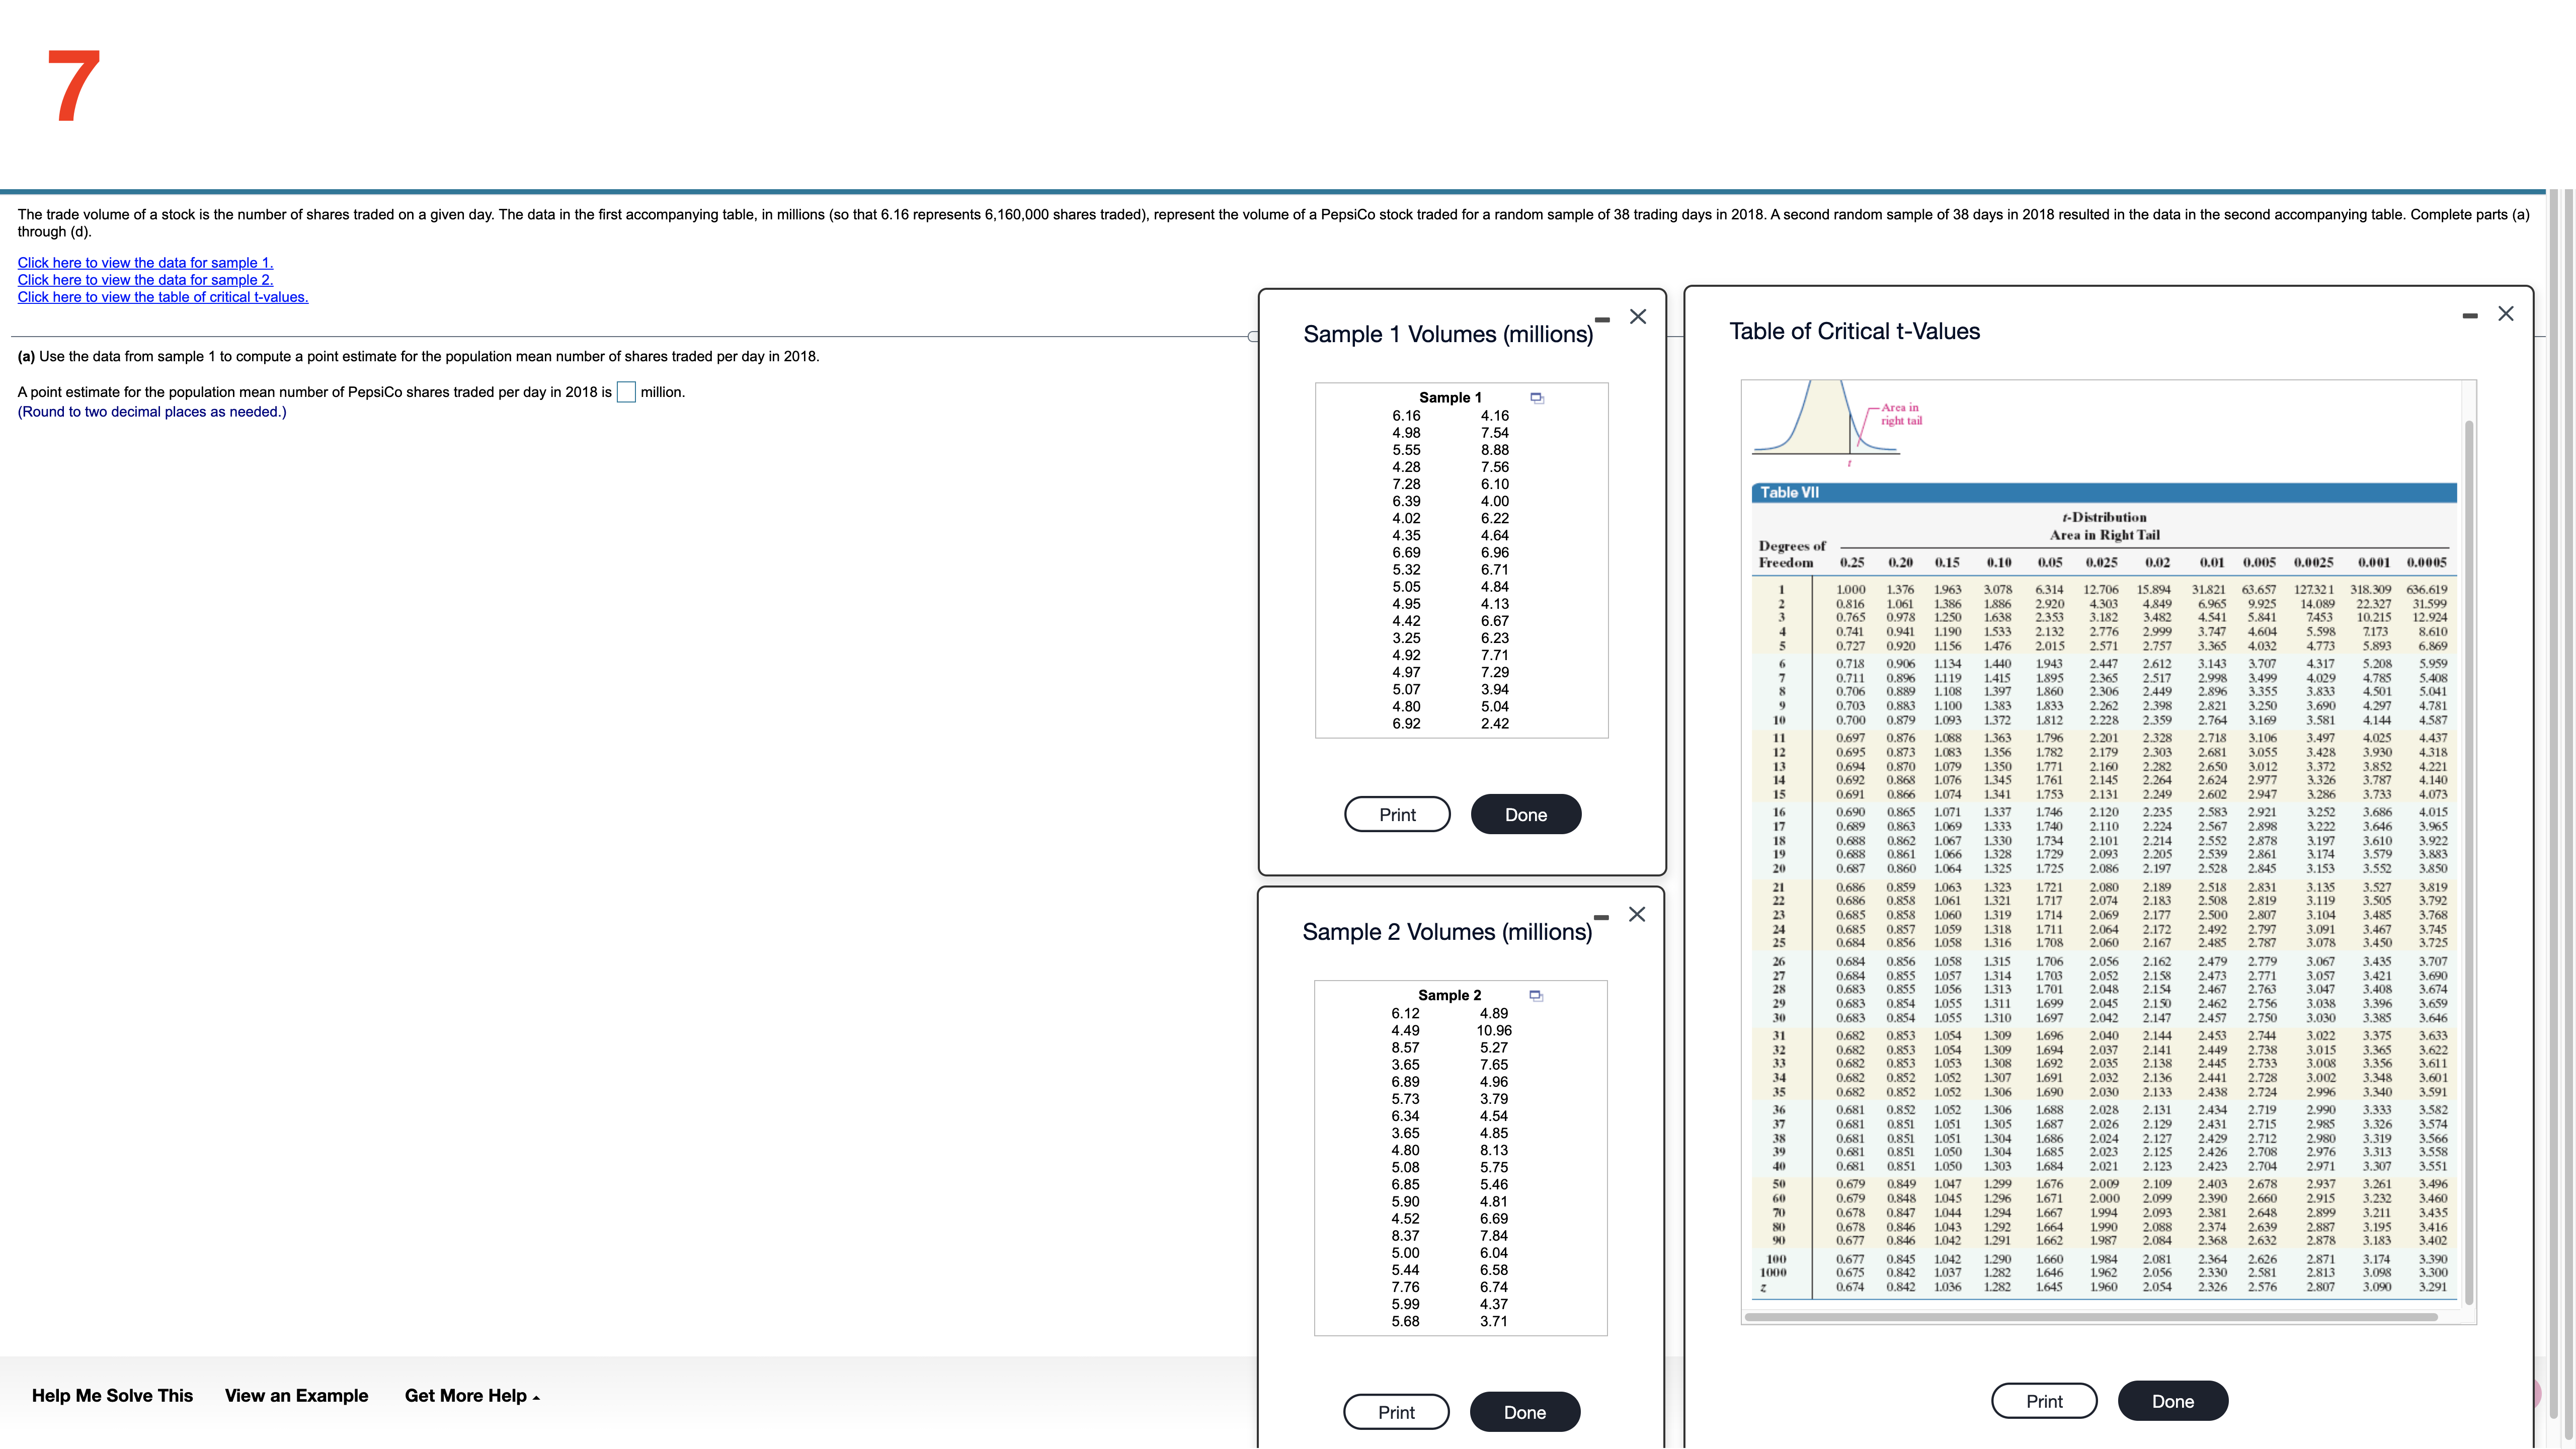
Determine the point estimate of the population proportion, the margin of error for the following confidence interval, and the number of individuals in the sample with the specified characteristic, x, for the sample size provided. Lower bound = 0. 192, upper bound = 0.648, n = 1500 The point estimate of the population proportion is. (Round to the nearest thousandth as needed.) Help Me Solve This View an Example Get More Help - Clear All Check Answer2 A survey of 2287 adults in a certain large country aged 18 and older conducted by a reputable polling organization found that 422 have donated blood in the past two years. Complete parts (a) through (c) below. Click here to view the standard normal distribution table (page 1). Click here to view the standard normal distribution table (page 2). (a) Obtain a point estimate for the population proportion of adults in the country aged 18 and older who have donated blood in the past two years. p= (Round to three decimal places as needed.) - X -X Standard Normal Distribution Table (page 1) Standard Normal Distribution Table (page 2) Standard Normal Distribution Standard Normal Distribution 0.00 0.01 0.02 0.03 0.04 0.05 0.06 0.07 0.08 0.09 0.00 0.01 0.02 0.03 0.04 0.05 0.06 0.07 0.08 0.09 0.0003 0.000 0.0003 0.0003 0.5000 0.504 0.5080 0.5120 0.$160 0.5199 0.5239 0.5279 0.5319 0.5359 0.0003 0.0003 0.0003 0.0003 0.0004 0 0904 0.0004 0.0003 0.5398 0.5478 0.5517 0.5557 0.5596 0.5636 0.0005 0.0004 0.5675 0.5714 0.5753 0.0005 0.0004 0.0004 0.5871 0.5948 0.5987 0.6103 0.0007 0.0006 0.5910 0.0007 0.0006 0.0006 0.0005 0.0005 0.5793 U.6020 0.0005 0.6064 0.1009 0.0006 0.5832 0,0007 .6179 0.6217 0.6255 0.6293 0.6331 0.6406 0.644 0.6480 0.0141 0.0010 0.0009 0.0009 0.0008 0.0008 0.0008 0.0008 0.0007 0.6879 0.0013 0.0013 0.0013 0.001 0.0012 0.0011 0.0011 0.0011 0.0010 0.0010 3.6554 0.6591 0.6628 0.6664 0.6700 0.6736 0.6772 0.0019 0.0018 0.0018 0.001 0.0016 0.0016 0.0015 0.0015 0.0014 0.6915 0.6950 0.698 0.7123 0.7157 0.7257 0.7389 0.7422 0.7454 0.7486 0.0026 0.0025 0.0024 0.7794 0.003 0.0030 0.0029 0.0026 0.7642 0.004 0.004 0.0041 0 0040 0.0039 0.0036 0 . 78 8 0.7939 0.8078 0.8340 -2.5 0.0060 0.0059 0.0054 0.0051 0.0048 0.8159 0:8186 0.8212 0.8289 0.0082 0.0078 0.0675 0.0073 0.0069 0.843 0.8461 0.8531 0.8577 0.879 0.0096 0.8925 0.8980 0 0177 0.017 0174 0.9147 0.0170 0.016 0.0162 0.0150 0.904 0.9066 0.0207 0.0192 0.0183 1.9192 0.9207 0.9222 0.9251 0.9265 0.9292 0.9319 0.0228 0.0222 0.0217 0.0212 0.0197 0.9441 0.0287 0.0281 0.0268 0.0262 0.0244 0.0233 .9332 0.9357 0.9370 0.9382 0.9394 0.9406 0.9418 0.0359 0.0351 0.033 0.0329 0.946 0.9474 0.9495 0.9545 0.0409 0.0384 0.9591 0.9616 0.051 0.0505 0.0475 0.0455 9641 0.964 0.9656 0.9671 0.9693 -1.5 0.0655 0.0630 0.0618 0.0606 0.0594 0.0582 0.0559 .9713 0.971 0.9726 0.9732 0.9738 0.9744 0.9756 0.9767 0.0764 0.0749 0.0735 0.0721 0.0708 0.9793 0.0918 0 0853 0.0681 8.977 0.9783 0.980 0.0823 0.9838 0.1038 0.1020 0.0985 0.9875 0.988 0.1075 0.129 0.1271 0.1230 0.1210 0.1170 0.9904 0.9911 0.1587 0.151 0.1492 0.1469 0.1446 0.1423 0.1379 0.992 0.9922 0.9925 0.9927 0.9932 0.1539 0.1660 0.1611 0.9949 0.1841 0.1762 0.1736 0.904 0.9945 0.1949 6:0080 0.996 0.2420 0.180 0.997 0.2296 0.2743 0.2709 0 2643 02546 02451 0.9976 0.9977 0.9977 0.9979 0.3085 0.3015 0.2981 0.2946 0.2912 0.2877 0.2843 0.2810 0.2776 28660 0.9982 0.0983 0.9985 0.9986 -04 0.3446 0.3409 0.3372 0.3336 0.3300 0.3264 0.3192 0.3156 0.3121 .9987 0.9987 0.9988 0.9989 0.9989 0.9990 0.9990 8 3504 0.3557 0.9991 0.9991 0.9092 0.9992 0 9092 0.3821 0.3745 0.3707 0.3669 0.3632 0.9992 0.3936 0 3807 0.385 0.909 0.9994 0.9994 0.9094 0.9994 0.9095 0.9095 0.4168 0.4129 0.4090 0.3974 0.9997 4562 0.9096 0.9096 0.9996 0.4602 3.4522 0.4483 0.4443 0.4404 0.4364 0.4325 0.4286 0.4247 0.9095 898 0.9995 0.9996 0.9996 0.9996 0.9997 0.9097 0.9997 0.9997 0.9097 0.9998 0.5060 4960 9.4920 0.488 0.4840 0.4801 0.4761 0.4721 04681 0.4641 9097 0.9997 0.9997 0.0 0.01 0.02 0.03 0.04 0.05 0.06 0.07 0.08 0.09 0.00 0.01 0.02 0.03 0.04 0.05 0.06 0.07 0.08 0.09 Done Print Done Print Help Me Solve This View an Example Get More Help -3 The trade magazine QSR routinely checks the drive-through service times of fast-food restaurants. A 90% confidence interval that results from examining 649 customers in Taco Bell's drive-through has a lower bound of 156.2 seconds and an upper bound of 159.2 seconds. Complete parts (a) through (c) (a) What is the mean service time from the 649 customers? The mean service time from the 649 customers is seconds (Type an integer or a decimal. Do not round.) Help Me Solve This View an Example Get More Help - Clear All Check Answer4 A simple random sample of size n is drawn from a population that is normally distributed. The sample mean, x, is found to be 109, and the sample standard deviation, s, is found to be 10. (a) Construct a 96% confidence interval about u if the sample size, n, is 14. (b) Construct a 96% confidence interval about u if the sample size, n, is 18 c) Construct a 98% confidence interval about u if the sample size, n, is 14. Table of t-Distribution Areas (d) Could we have computed the confidence intervals in parts (a)-(c) if the population had not been normally distributed? Click the icon to view the table of areas under the t-distribution. (a) Construct a 96% confidence interval about u if the sample size, n, is 14. Lower bound: ; Upper bound: (Use ascending order. Round to one decimal place as needed.) Area in right tail Table VI t-Distribution Area in Right Tail df 0.25 0.20 0.15 0.10 0.05 0.025 0.02 0.01 0.005 0.0025 0.001 0.0005 1.000 1.376 1.963 3.078 6.314 12.706 15.894 31.821 63.657 127.321 318.309 636.619 0.816 1.061 1.386 1.886 2.920 4.303 4.849 6.965 9.925 14.089 22.327 31.599 0.765 0.978 1.250 1.638 2.353 3.182 3.48 4.541 5.841 7.453 10.215 12.924 DAWN 0.741 0.941 1.190 1.533 2.132 2.776 2.999 3.747 4.604 5.598 7.173 8.610 0.727 0.920 1.156 1.476 2.015 2.571 2.757 3.365 4.032 4.773 5.893 6.869 0.718 0.906 1.134 1.440 1.943 2.447 2.612 3.143 3.707 4.317 5.208 5.959 0.711 0.896 1.119 1.415 1.895 2.365 2.517 2.998 3.499 4.029 4.785 5.408 0.706 0.889 1.108 1.397 1.860 2.306 2.449 2.896 3.355 3.833 4.501 5.041 0.703 0.883 1.100 1.383 1.833 2.262 2.398 2.821 3.250 3.690 4.297 4.781 10 0.700 0.879 1.093 1.372 1.812 2.228 2.359 2.764 3.169 3.581 4.144 4.587 0.697 0.876 1.088 1.363 1.796 2.201 2.328 2.718 3.106 3.497 1.025 4.437 0.695 0.873 1.083 1.356 1.782 2.179 2.303 2.681 3.055 3.428 3.930 4.318 0.694 0.870 1.079 1.350 1.771 2.160 2.282 2.650 3.012 3.372 3.852 4.221 0.692 0.868 1.076 1.345 1.761 2.145 2.264 2.624 2.977 3.326 3.787 4.140 15 0.691 0.866 1.074 1.341 1.753 2.131 2.249 2.602 2.947 3.286 3.733 4.073 16 0.690 0.865 1.071 1.337 1.746 2.120 2.235 2.583 2.921 3.252 3.686 4.015 17 0.689 0.863 1.069 1.333 1.740 2.110 2.224 2.567 2.898 3.222 3.646 3.965 0.688 0.862 1067 1.330 1.734 2.101 2.214 2.552 2.878 3.197 3.610 3.92 0.688 0.861 1.066 1.328 1.72 2.093 2.205 2.539 2.861 3.174 3.579 3.883 20 0.687 0.860 1.064 1325 1.725 2.086 2.197 2.528 2.845 3.153 3.552 3.850 21 0.686 0.859 1.063 1.323 1.721 2.080 2.189 2.518 2.831 3.135 3.527 3.819 0.686 0.858 1.061 1.321 1.717 2.074 2.183 2.508 2.819 3.119 3.505 3.792 0.685 0.858 1.060 1.319 1.714 2.069 2.177 2.500 2.807 3.104 3.485 3.768 0.685 0.857 1.059 1.318 1.711 2.064 2.172 2.492 2.797 3.091 3.467 3.745 Print Done Help Me Solve This View an Example Get More Help -5 The following data represent the pH of rain for a random sample of 12 rain dates. A normal probability plot suggests the data could come from a population that is normally distributed. A boxplot indicates there are no outliers. Complete parts a) through d) below. 5.58 5.72 5.24 4.80 5.02 4.5 4.74 5.19 4.61 4.76 4.56 Click the icon to view the table of critical t-values. (a) Determine a point estimate for the population mean. A point estimate for the population mean is. -X (Round to two decimal places as needed.) Table of Critical t-Values right ta 1-Distribution Degrees of Area in Right Tail Freedom 0.25 0.20 0.15 0.10 0.05 0.025 0.02 0.01 0.005 0.0025 0.001 0.0605 1.000 1.061 1.963 3.078 4.303 31.821 63.657 127.321 318.309 636.619 0.765 14.080 22.327 31.599 5.598 10.215 0:727 5803 0.718 5.208 5.959 4.785 4:501 4.781 2.228 4.144 4.587 4.437 1318 4.140 3.733 4.073 4.015 $8 88588 89898 88 8 8 8 125 8 8 Degrees of 0.25 0.20 0.15 0.10 0.05 0.025 0.02 0.01 0.005 0.0025 0.001 0.0605 Freedom f-Distribution Area in Right Tail Help Me Solve This View an Example Get More Help -6 The data shown below represent the repair cost for a low-impact collision in a simple random sample of mini- and micro-vehicles (such as the Chevrolet Aveo or Mini Cooper). Complete parts (a) through (c). $3147 $1043 $728 $634 $784 $1710 $3326 $2080 $2662 $1357 Click here to view page 1 of the standard normal distribution table. Click here to view page 2 of the standard normal distribution table. Click here to view the table of critical t-values. (a) Draw a boxplot to check for outliers. Choose the correct answer below. O A. B VC. OD 2000 4000 0 2000 4000 2000 4000 0 2000 4000 (b) Construct and interpret a 95% confidence interval for the population mean cost of repair Does the boxplot suggest that it is reasonable to construct a confidence interval for the population mean? A. Yes, the distribution is roughly symmetric and there are no outliers. O B. No, the distribution is roughly symmetric with no outliers. C. No, the boxplot shows there are outliers O D. Yes, the distribution is highly skewed with outliers. If the boxplot suggests a confidence interval can be constructed, calculate and interpret the lower bound and the upper bound of the confidence interval. Select the correct choice below and, if necessary, fill in the answer boxes to complete your choice. Round to the nearest dollar. Use ascending order.) O A. We are 95% confident that the mean cost of repair is between $ and $ O B. There is a 95% probability that the mean cost of repair is between $ and $. O C. The confidence interval should not be constructed. Help Me Solve This View an Example Get More Help - Clear All Check Answer6 (part 2, showing graphs). m an. mm. mm revues-n! lb: may: can lot . Winn-Ia mun-Inn In l mu. "Mum mm. M um um mum-mus (am. n m. ChmlmAm of mm coupon. (mu-m pm: (A) mmunn (a) 53m 5104: me $334 :7 mm sms men me: 31:51 1 r ('1)an : mm w m for nuum. Chaos. m. m mm Dem. A Sandam Normal Distrib Am: | /\\_ able v Sundud Nomul Dhrlnnhn 1 mm mm um um om 0.415 m Mn Mu um mm mm mm mm mm Mm: mm mm: mm mm was was was now new om new am new (mm mm am um um am um mm mm am am (Loom woo woo mom was om moms mm (worn 0mm Mm: mm: mm: mm: mm: mm\" mm\" Man mm mm mm mm: moms mum moms mm mm mom: 1mm: (mun 0.0026 mus mm mm om 0mm om: ovom (Loam 01mm 0035 am mom: mm: my mm mm mm: noun (may; mow nous now now new uomo om nous: 0037 my. onmz mm am new mass am 0052 my my (mm mm: omen mum nm-Is am mm mm um mm mm 0mm 0mm 0mm mom om am noon now) own um Imuw mm mm: Mlzv Imus 4mm mm? mm; mm] mm onm onm 0mm no!\" omsz muss om 0.0150 onus onus 4mm mm mm Mm Mm mm; mm Mun Mm (mun m7 an: mm Mm mm om mm nmu mm (um: am 0351 new cums 0329 omzz now am noun (mm was was M1421 mom mm mm new: mm \"0315 011357 (mm 0537 (mm 0.0516 was muss muss om: ms wuss mm mass new new mom mm; new moss: 110571 1559 am mm: mm! M754 Mun mm mm: mm am am am 0951 0934 mom now: om now runs: nous om mm mm mm mm mm muss mus: mnzu mm mm mm 1335 mm mm (um um) (um cum (um mm mm msaz mm nuns mm 4mm mm mm: mun mm mm mm 0.118: mm 0.1136 mm mass mm 0.151; mm 02119 02090 02061 am: 02005 awn (um cum own mm mm mm mm mm am am 2236 nuns um um 02743 on 02675 cum 02511 was om uzsu 02m 0245) am um um um am. um 02:77 was 01an um am am mm mm am 03264 122: mm 3156 um um om um: um om 0.1612 0.1594 cuss7 om 034:: mm mm mm mm mm: mm: mm mm am mm W ow om was om W om runs om 042:7 415000 mm mm mm mm mam M161 M711 mm mm Standard Normal Distribution Table (Page 2) a Are: 1 sum-m Nam-I nmmlm z .011 Ml m mm mm Ms m M7 (LII m 0.0 05000 5040 om usm uslso 05m 05m uszn 05:19 0.959 0.1 um 11543: asm nssn nssm nsm rum nsns n57\" 5153 0.: 05m 592 0x7! mlo W 05987 me mm mm mm 0.1 um um ans; mm nml um nuns as\": mam mm M Mm cm W W MM 0.6716 (mm um um mm 05 um 5950 Moss um? um Moss am: an\" (moo arm 06 any mm: mm mm mam mm: mm was n75" mm 0.1 (men ml 0.7642 um: (mm am Mm (\"794 mm mm 0.: mm 0.1m mm mm mm m3 \".5051 um nuns mm 0.0 um am 03212 on um um um am am Imus In nun Mu ow: was um am: my um um mm 1.: um um mans um: nmv um um um um man Lz um Maw om um was (mu um am am moms 1.1 mm new mm mm mm um: mm: mm Mm mm M (mm (mm am ums um: (mas am (mm mm 0.9319 Is mm: 9345 new um um um was was mm mm I6 mm 0.9461 mm mm was nvsus nvsls naszs 0.9535 M4: L1 0.9554 (ma mm: uassz um: am am (mm (mm now u max new mass mm mm mm um um mm mm Lo tum: 9719 mm wine was new 19150 (me (mm mm Ln awn am um um um am am: am 0.9812 men 2.1 mm um mm mm mm am new noose new r0957 2.2 was] Mesa um mm was nos-In now (my 0.9681 mean 2.1 mm um um um] um um um n99\" mm: 4mm 24 (mm mo am uwzs mam amt.) am: am (my ".9936 25 mm: mm 0.994] mm mus am mm mm Mos: mm 1.6 was: 9955 mass may nwsv um um um mm mm 2.1 am 9966 4x9961 um um um awn um (mm mom 2.: mm: 9975 um um mm mm mm mm mm mm 2.0 was] 9982 um um um am am (mas um mm m mm 9987 Wu um um um um um um mm 3.1 mm 0.999] am: am: am mm mm Mm Mm mm 5.2 mm: am: um um um um um 0.9995 am mm: H mm 119995 0.9995 um um um um um mm mm 14 am 9997 (MW (mm um am (mm (mm (mm mm \\Q) - c) Table of Critical t-Values '' 9 up\". mun mum. Anlh m \" m NIH-u us as us an ms nu mm: mm uns was u: Mus ; munmmunmunmmmlmmmv 2 Mummmzmmmkmxmmmam : mm M" m m. m m: m: m: \"a 145: um 12.714 . um um um I) ma; 2m 15 mu m x. 10: mu 5 um am u; in am: 7J1] 2.751 ms M 4m 5m and ' mu was 1.134 m. 196 gm nu mu m an m \"a! 1 um um Lu! ms us m 2,311 w- my my an m . ms m u.- um um m z; in us; am An: mu ; Mm ma non us: In) 2n 2:: m m m Am m. n mu m u: u'n m2 22:: us 1.7\" m- m \"M an n m ms u- us! um mm m 2.7.. ms an: AM n n mm ms 11:: us m 2179 um :11 Mus m: use u]: u um um um u m 2m nu um am: am us: all u m um um U45 m: 21 m m. 2511 ms nu ma .5 m. um um Lu. m: 1m 23.9 1m 2m 1m 1131 m n m um um L131 m mo La: m m an: ms ml: .1 an m um 1:33 Lun mu m. nu mu am m us: n m m um um um um 2114 us: 217! My! mm m: u m. ms: nu um m m m mg mi 1m as m 1- w um um uu ms 2416 Lin m. m m: m: an) 11 ms m m an 1m 2m 2.:- um um ms 1m 3119 2 ans um um uu m7 m an m u\" my 155 m n m m m ms nu 2M 1.117 m an no. ms m- u w as: man an nu m m: m um m1 m m u m m ms. u\" um um um um 1m um um ms I am m In uu m nus ms: 1m 2119 um w xm n m- us; 1151 um um um m 1m 1m 3m :41 m n m ms m m; mu m m m 2m am am 3414 n m m mas uu m 206 m m 2155 m 33's m :- m m was mu w 2042 1.141 1451 m: Mm 535 w .u m an: m m ws me 2.1M us mu m 131: m: .u m us 1154 m um um 1m m 2.1: ms us m: u m m um um m: mas 1m w u m m u\" u m um um um um m we m m- m m Mm u m um um m. um mm 1.13: m- m4 an um ml 3 um um m m u- mu m. m. 2.11! 1m u): \"n ,1 um um um um m am am m. 1.115 \"a mu m u m m. m: m ms mu m: In! 2.1.2 2m in; u\" u m m m m ms mu m: u: um ms mu :5: u m um um um 1554 2112: ms ms 2.1m an my m s. m um mu m 1:): 2m 1m 1m 2m 2557 m m u m m ms m \"1: 2m up! m m: an: m: mo in um um w m m w my: nu m. In W ms :1 m nu mu m nu me u- m m m 1L9: um I: m m m m m m m m m an all: m um um nus m m um m 11-: no. 1a m mu m m. am no m7 1' m m M um um an m m 1 M74 m m m m um um um 2m 2m m m 7 through (d). The trade volume of a stock is the number of shares traded on a given day. The data in the first accompanying table, in millions (so that 6.16 represents 6, 160,000 shares traded), represent the volume of a PepsiCo stock traded for a random sample of 38 trading days in 2018. A second random sample of 38 days in 2018 resulted in the data in the second accompanying table. Complete parts (a) Click here to view the data for sample 1. Click here to view the data for sample 2. Click here to view the table of critical t-values. X X Sample 1 Volumes (millions) Table of Critical t-Values (a) Use the data from sample 1 to compute a point estimate for the population mean number of shares traded per day in 2018. A point estimate for the population mean number of PepsiCo shares traded per day in 2018 is ||million. Sample 1 (Round to two decimal places as needed.) 6.16 4.16 4.98 7.54 right tail 5.55 8.88 4.28 7.56 7.28 6.10 6.39 4.00 Table VII 4.02 6.22 1-Distribution 4.35 4.64 Area in Right Tail 6.69 6.96 Degrees of 5.32 6.71 Freedom 0.25 0.20 0.15 0.10 0.05 0.025 0.02 0.01 0.005 0.0025 0.001 0.0605 5.05 4.84 1.000 4.95 1.963 3.078 6.314 4.13 1.376 12.706 15.894 31.821 127.321 318.309 636.619 0.816 1.061 1.886 2.920 4.303 4.849 63.657 6.965 9.925 14.089 22.327 31.599 4.42 6.67 0.765 0.941 2.353 7453 3.747 12.924 6.23 1.533 10.215 3.25 5.598 7.173 8.610 4.92 7.71 0.727 0.920 2015 2.757 3.365 4.032 4.773 5.893 6.869 4.97 7.29 0.718 2.612 4.317 5.208 5.07 3.94 4.029 4.80 5 04 6.92 2.42 2.359 3.169 3.581 2.718 2.650 2.602 Print Done 2.583 3.153 Sample 2 Volumes (millions) X Sample 2 6.12 4.89 4.49 10.9 8.57 5.27 3 65 7.65 6.89 4.96 5.73 3.79 6.34 4.54 3.65 4.85 4.80 8.13 5.08 5.75 6.85 5.46 5.90 4.81 4.52 6.69 8.37 7.84 5.00 6.04 5.44 6.58 7.76 6.74 5.99 4 37 5.68 3.71 Help Me Solve This View an Example Get More Help - Print Done Print Done8 The trade magazine QSR routinely checks the drive-through service times of fast-food restaurants. A 95% confidence interval that results from examining 519 customers in Taco Bell's drive-through has a lower bound of 156.2 seconds and an upper bound of 160.0 seconds. Complete parts (a) through (c). (a) What is the mean service time from the 519 customers? The mean service time from the 519 customers is seconds (Type an integer or a decimal. Do not round.) Help Me Solve This View an Example Get More Help - Clear All Check
Step by Step Solution
There are 3 Steps involved in it

Get step-by-step solutions from verified subject matter experts