

Answered step by step
Verified Expert Solution
Question
1 Approved Answer
need help with second part i can't get the table formula to work idk how to do it How sensitive is the current stock price
 need help with second part i can't get the table formula to work idk how to do it
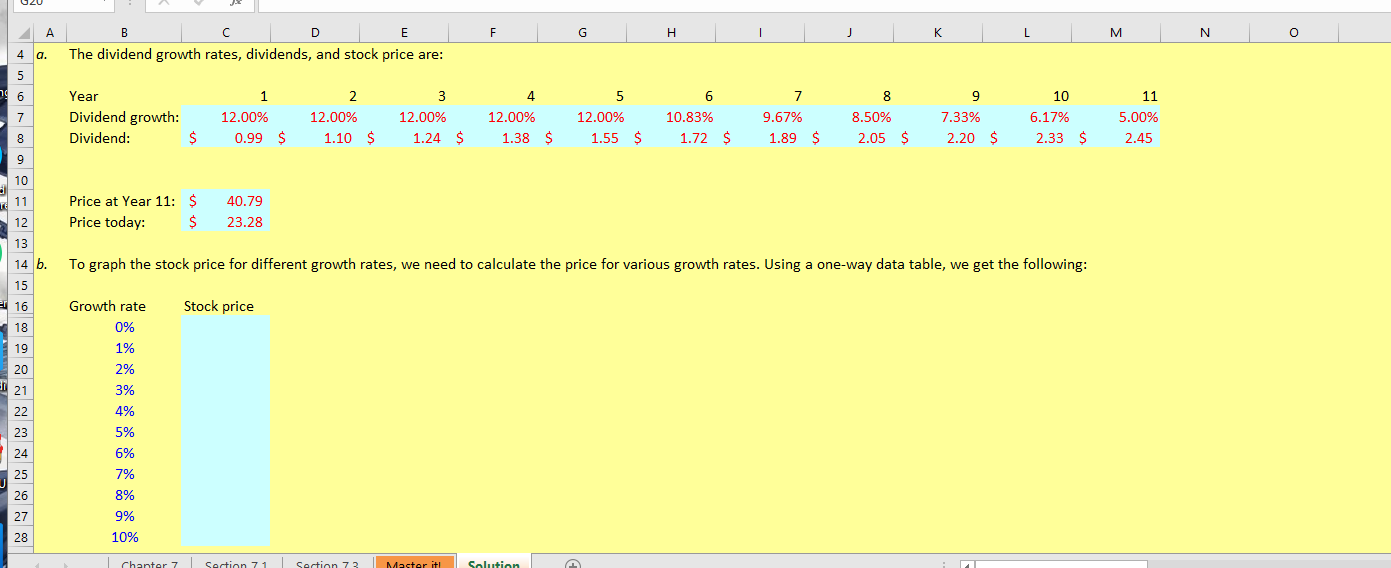
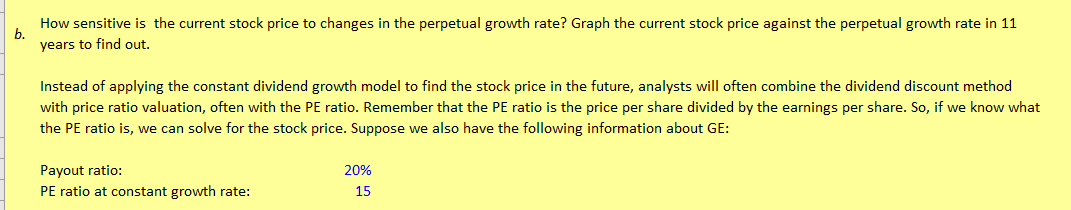
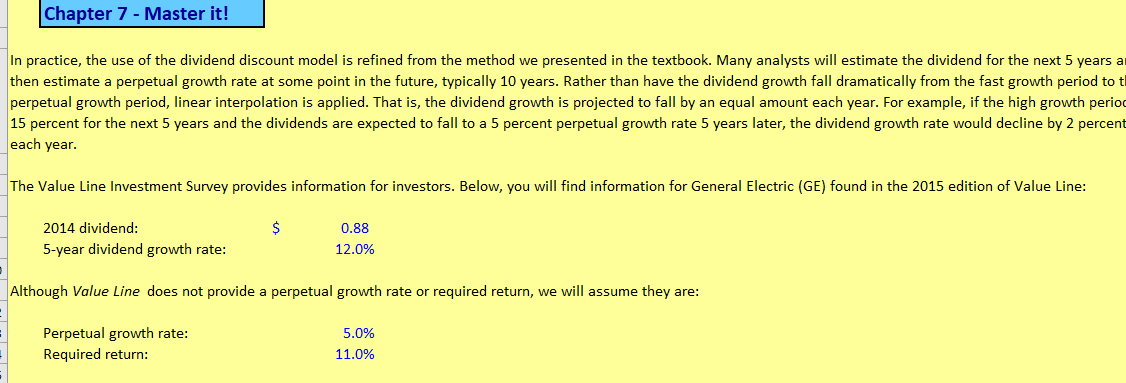
How sensitive is the current stock price to changes in the perpetual growth rate? Graph the current stock price against the perpetual growth rate in 11 years to find out. Instead of applying the constant dividend growth model to find the stock price in the future, analysts will often combine the dividend discount method with price ratio valuation, often with the PE ratio. Remember that the PE ratio is the price per share divided by the earnings per share. So, if we know what the PE ratio is, we can solve for the stock price. Suppose we also have the following information about GE: 20% Payout ratio: PE ratio at constant growth rate: 15 Chapter 7 - Master it! In practice, the use of the dividend discount model is refined from the method we presented in the textbook. Many analysts will estimate the dividend for the next 5 years a then estimate a perpetual growth rate at some point in the future, typically 10 years. Rather than have the dividend growth fall dramatically from the fast growth period to t perpetual growth period, linear interpolation is applied. That is, the dividend growth is projected to fall by an equal amount each year. For example, if the high growth period 15 percent for the next 5 years and the dividends are expected to fall to a 5 percent perpetual growth rate 5 years later, the dividend growth rate would decline by 2 percent each year. The Value Line Investment Survey provides information for investors. Below, you will find information for General Electric (GE) found in the 2015 edition of Value Line: 2014 dividend: 5-year dividend growth rate: 0.88 12.0% Although Value Line does not provide a perpetual growth rate or required return, we will assume they are: Perpetual growth rate: Required return: 5.0% 11.0% G F H I J K L M N A 4 a. O B C D E The dividend growth rates, dividends, and stock price are: 11 2 Year Dividend growth: Dividend: 1 12.00% 0.99 $ 12.00% 1.10 12.00% 1.24 $ 7 9.67% 1.89 12.00% 1.38 8 8.50% 2.05 $ 9 7.33% 2.20 12.00% 1.55 10 6.17% 2.33 $ $ 10.83% 1.72 $ $ $ $ $ $ 5.00% 2.45 Price at Year 11: $ Price today: $ 40.79 23.28 14 b. To graph the stock price for different growth rates, we need to calculate the price for various growth rates. Using a one-way data table, we get the following: Growth rate Stock price 0% 9% 10% chanter 7 Section 71 Section 73. Master itl Solution How sensitive is the current stock price to changes in the perpetual growth rate? Graph the current stock price against the perpetual growth rate in 11 years to find out. Instead of applying the constant dividend growth model to find the stock price in the future, analysts will often combine the dividend discount method with price ratio valuation, often with the PE ratio. Remember that the PE ratio is the price per share divided by the earnings per share. So, if we know what the PE ratio is, we can solve for the stock price. Suppose we also have the following information about GE: 20% Payout ratio: PE ratio at constant growth rate: 15 Chapter 7 - Master it! In practice, the use of the dividend discount model is refined from the method we presented in the textbook. Many analysts will estimate the dividend for the next 5 years a then estimate a perpetual growth rate at some point in the future, typically 10 years. Rather than have the dividend growth fall dramatically from the fast growth period to t perpetual growth period, linear interpolation is applied. That is, the dividend growth is projected to fall by an equal amount each year. For example, if the high growth period 15 percent for the next 5 years and the dividends are expected to fall to a 5 percent perpetual growth rate 5 years later, the dividend growth rate would decline by 2 percent each year. The Value Line Investment Survey provides information for investors. Below, you will find information for General Electric (GE) found in the 2015 edition of Value Line: 2014 dividend: 5-year dividend growth rate: 0.88 12.0% Although Value Line does not provide a perpetual growth rate or required return, we will assume they are: Perpetual growth rate: Required return: 5.0% 11.0% G F H I J K L M N A 4 a. O B C D E The dividend growth rates, dividends, and stock price are: 11 2 Year Dividend growth: Dividend: 1 12.00% 0.99 $ 12.00% 1.10 12.00% 1.24 $ 7 9.67% 1.89 12.00% 1.38 8 8.50% 2.05 $ 9 7.33% 2.20 12.00% 1.55 10 6.17% 2.33 $ $ 10.83% 1.72 $ $ $ $ $ $ 5.00% 2.45 Price at Year 11: $ Price today: $ 40.79 23.28 14 b. To graph the stock price for different growth rates, we need to calculate the price for various growth rates. Using a one-way data table, we get the following: Growth rate Stock price 0% 9% 10% chanter 7 Section 71 Section 73. Master itl Solution
Step by Step Solution
There are 3 Steps involved in it
Step: 1

Get Instant Access to Expert-Tailored Solutions
See step-by-step solutions with expert insights and AI powered tools for academic success
Step: 2

Step: 3
Ace Your Homework with AI
Get the answers you need in no time with our AI-driven, step-by-step assistance
Get Started
Digital Marketing
Authors: Gregory Thornhill
1st Edition
1709572469, 978-1709572463