Need help with the 5 W's (who, what, when, where, why and how) of this study
what methods is used in this analysis (outputs of graphs/table)
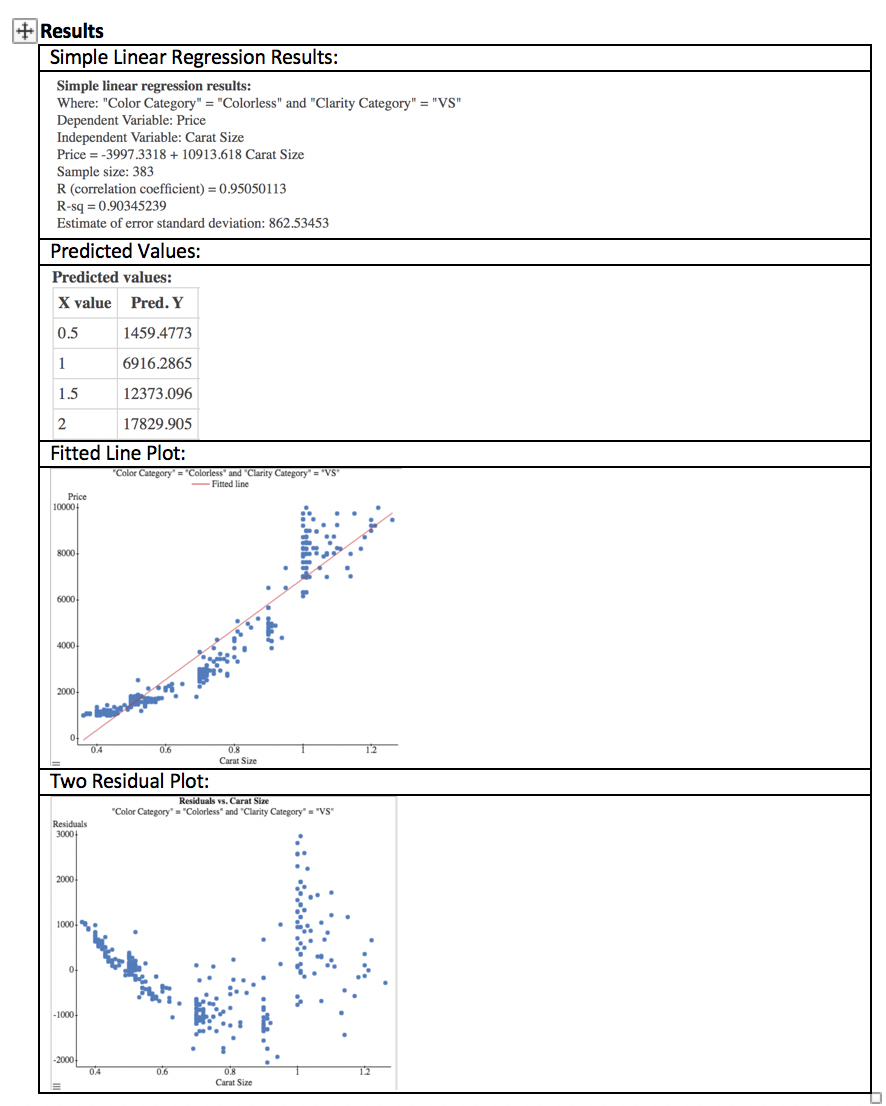
Listed below are the results, how and what should I put for these results? a) what does each graph tells us? (a summary of data)
is the four condition of the regression met or not? is the linear regression a good fit for the data?
what is a good conclusion summary of the results?
Project 1: Basic Displays, Correlation and Regression LEARNING OBJECTIVES: 0 Start building statistical report writing skills which will include the following sections: intro, methods, results, discussion, and conclusion. 0 Generate simple linear regression output complete with a fitted line plot, residual plot, and prediction chart using statistical software. 0 Format the output in a clear manner by appropriately sizing, labeling, titling, placing, and referencing of each visual in the report. \"(I 0 State the "who,\" \"what,\" \"when,\" "where, why,\" and \"how\" of the study. 0 Report the results of a regression analysis clearly and thoroughly. 0 Discuss whether the conditions for regression have been met or not. 0 Discuss whether the linear regression is appropriate for the given data or not. PROJECT: Buying diamonds for a milestone event, like an engagement, happens all the time. Anyone who has bought a diamond knows about the 4 C5: carat, color, cut and clarity. Suppose you are an analyst for a big Ohio diamond company called Diamonds 2600. In November of 2019 another analyst for Diamonds 2600 was able to collect this diamond data set information from Adiamor's inventory posted online. This data set contains information on Adiamor's 2,688 diamonds. It is your job to write a report informing your boss of the following ndings: The report must generate a linear regression that predicts the diamond price based on carat size and this is only for the subset of diamonds that have a color category of colorless and clarity category of V5. This amounts to 383 diamonds. Furthermore, you have been asked to look at price predictions for these types of diamonds with the following carat sizes: 0.5 carats, 1 carat, 1.50 carats, and 2.00 carats. The purpose ofthe linear regression is to reveal Adiamor's pricing based on carat size. This will allow your company, Diamonds 2600, to price more competitively with Adiamor. The directions for generating the visuals from StatCrunch are on the 2rld page. The 3rd page discusses the general format of a statistical report. Furthermore, to see the item-by-item detail of what is expected in your report refer to the Project 1 Grading Rubric document and the Sample Project document posted online. Basic Statistical Report Format: Your report will need to be written as a statistical report with a very specific formatting of: Title, Introduction, Methods, Results, Discussion and Conclusion. Write this report as if it would be given to your boss or a client meaning it needs to be presentable and easy to read. Introduction An introduction should describe the general context and background, including a general description of what data are available, the manner in which they were collected and the purpose of this data collection. State the variables you use in your analysis (include units if possible). Methods The methods section needs to explain the methods used in this analysis: what output (graphs, tables, charts) did you generate for your report? State the statistical package you used in generating your analyses. Results All the statistical output (tables, charts, graphs) needs to be provided in this section along with the descriptions and explanations of these analyses. Discuss what each graph and numerical summary tells you about the data. Your goal should be to tell a story about your dataset, not simply to check off a list of graphs and summaries. Discussion In this section you can discuss whether the four conditions of the regression have been met or not and whether the linear regression is a good t for the data. Any reservations about the data or predictions made can also be discussed in this section. Conclusion In this section, provide a brief summary of the results. Conclusions should be expressed in a way that can be understood by a non-statistician and should make sense even if the reader of your report skipped over the detailed statistical analysis. Try to report the conclusion in the context of the scenario from which the data came. + Results Simple Linear Regression Results: Simple linear regression results: Where: "Color Category" = "Colorless" and "Clarity Category" = "VS" Dependent Variable: Price Independent Variable: Carat Size Price = -3997.3318 + 10913.618 Carat Size Sample size: 383 R (correlation coefficient) = 0.95050113 R-sq = 0.90345239 Estimate of error standard deviation: 862.53453 Predicted Values: Predicted values X value Pred. Y 0.5 1459.4773 6916.2865 1.5 12373.096 2 17829.905 Fitted Line Plot: Category" "Colorless" and "Clarity Category" = "VS - Fitted line Price 10000 8000 6000 4000 2000 0.8 Carat Size 12 Two Residual Plot: Residuals vs. Carat Size Residuals "Color Category" = "Colorless" and "Clarity Category" . "VS" 3000 2000 1000 -1000 -2000 0.6 12 Carat Size


