Need help with the graph and calculations
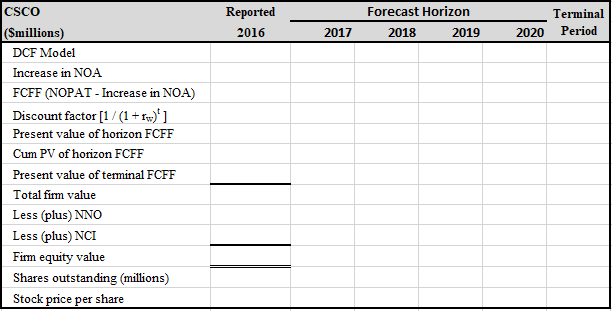
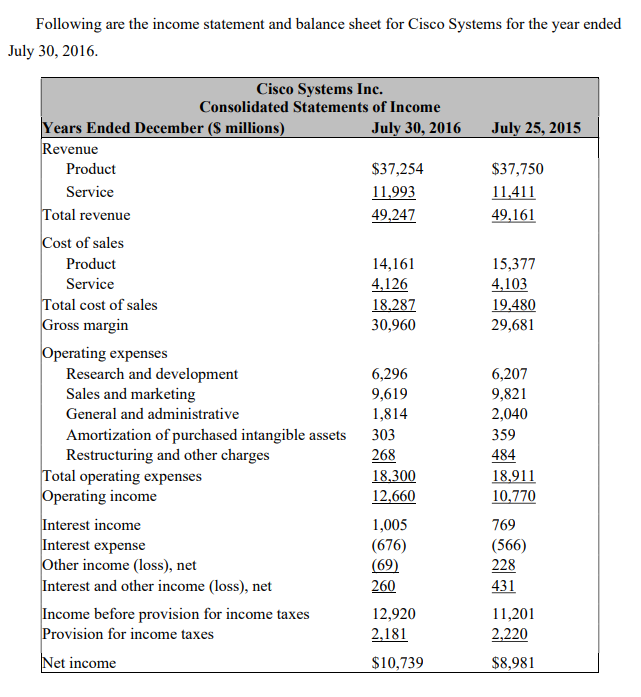
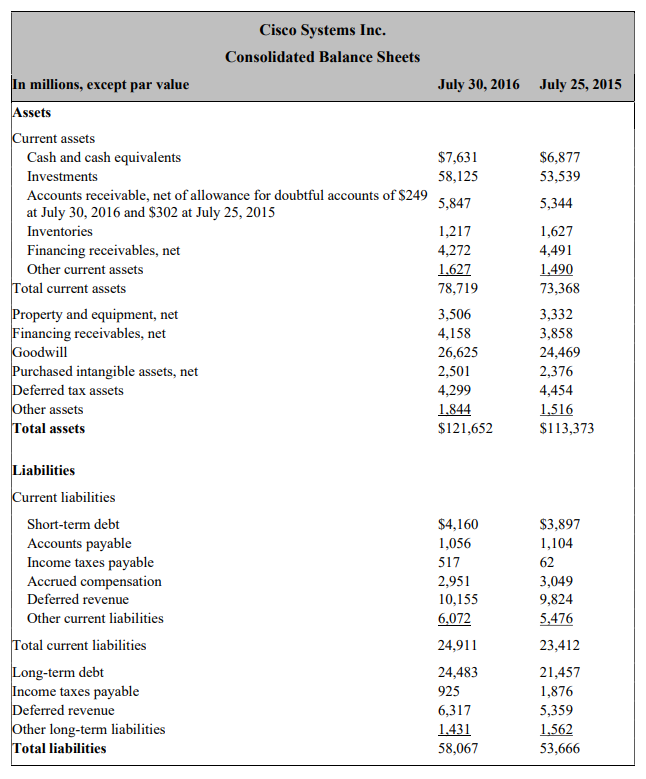
Following are the income statement and balance sheet for Cisco Systems for the year ended July 30, 2016. July 25, 2015 $37,750 11,411 49,161 15,377 4,103 19,480 29,681 Cisco Systems Inc. Consolidated Statements of Income Years Ended December ($ millions) July 30, 2016 Revenue Product $37,254 Service 11,993 Total revenue 49,247 Cost of sales Product 14,161 Service 4,126 Total cost of sales 18,287 Gross margin 30,960 Operating expenses Research and development 6,296 Sales and marketing 9,619 General and administrative 1,814 Amortization of purchased intangible assets 303 Restructuring and other charges 268 Total operating expenses 18,300 Operating income 12,660 Interest income 1,005 Interest expense (676) Other income (loss), net (69) Interest and other income (loss), net 260 Income before provision for income taxes 12,920 Provision for income taxes 2,181 Net income $10,739 6,207 9,821 2,040 359 484 18,911 10,770 769 (566) 228 431 11,201 2,220 $8,981 July 30, 2016 July 25, 2015 $7,631 58,125 $6,877 53,539 5,344 5,847 Cisco Systems Inc. Consolidated Balance Sheets In millions, except par value Assets Current assets Cash and cash equivalents Investments Accounts receivable, net of allowance for doubtful accounts of $249 at July 30, 2016 and $302 at July 25, 2015 Inventories Financing receivables, net Other current assets Total current assets Property and equipment, net Financing receivables, net Goodwill Purchased intangible assets, net Deferred tax assets Other assets Total assets 1,217 4,272 1.627 78,719 3,506 4,158 26,625 2,501 4,299 1.844 $121,652 1,627 4,491 1,490 73,368 3,332 3,858 24,469 2,376 4,454 1.516 $113,373 Liabilities Current liabilities Short-term debt Accounts payable Income taxes payable Accrued compensation Deferred revenue Other current liabilities Total current liabilities Long-term debt Income taxes payable Deferred revenue Other long-term liabilities Total liabilities $4,160 1,056 517 2,951 10,155 6,072 $3,897 1,104 62 3,049 9,824 5,476 24,911 24,483 925 6,317 1.431 58,067 23,412 21,457 1,876 5,359 1,562 53,666 CSCO Reported 2016 Forecast Horizon 2018 2019 Terminal Period 2017 2020 (Smillions) DCF Model Increase in NOA FCFF (NOPAT - Increase in NOA) Discount factor [1/(1+1w)'] Present value of horizon FCFF Cum PV of horizon FCFF Present value of terminal FCFF Total firm value Less (plus) NNO Less (plus) NCI Fimm equity value Shares outstanding (millions) Stock price per share Following are the income statement and balance sheet for Cisco Systems for the year ended July 30, 2016. July 25, 2015 $37,750 11,411 49,161 15,377 4,103 19,480 29,681 Cisco Systems Inc. Consolidated Statements of Income Years Ended December ($ millions) July 30, 2016 Revenue Product $37,254 Service 11,993 Total revenue 49,247 Cost of sales Product 14,161 Service 4,126 Total cost of sales 18,287 Gross margin 30,960 Operating expenses Research and development 6,296 Sales and marketing 9,619 General and administrative 1,814 Amortization of purchased intangible assets 303 Restructuring and other charges 268 Total operating expenses 18,300 Operating income 12,660 Interest income 1,005 Interest expense (676) Other income (loss), net (69) Interest and other income (loss), net 260 Income before provision for income taxes 12,920 Provision for income taxes 2,181 Net income $10,739 6,207 9,821 2,040 359 484 18,911 10,770 769 (566) 228 431 11,201 2,220 $8,981 July 30, 2016 July 25, 2015 $7,631 58,125 $6,877 53,539 5,344 5,847 Cisco Systems Inc. Consolidated Balance Sheets In millions, except par value Assets Current assets Cash and cash equivalents Investments Accounts receivable, net of allowance for doubtful accounts of $249 at July 30, 2016 and $302 at July 25, 2015 Inventories Financing receivables, net Other current assets Total current assets Property and equipment, net Financing receivables, net Goodwill Purchased intangible assets, net Deferred tax assets Other assets Total assets 1,217 4,272 1.627 78,719 3,506 4,158 26,625 2,501 4,299 1.844 $121,652 1,627 4,491 1,490 73,368 3,332 3,858 24,469 2,376 4,454 1.516 $113,373 Liabilities Current liabilities Short-term debt Accounts payable Income taxes payable Accrued compensation Deferred revenue Other current liabilities Total current liabilities Long-term debt Income taxes payable Deferred revenue Other long-term liabilities Total liabilities $4,160 1,056 517 2,951 10,155 6,072 $3,897 1,104 62 3,049 9,824 5,476 24,911 24,483 925 6,317 1.431 58,067 23,412 21,457 1,876 5,359 1,562 53,666 CSCO Reported 2016 Forecast Horizon 2018 2019 Terminal Period 2017 2020 (Smillions) DCF Model Increase in NOA FCFF (NOPAT - Increase in NOA) Discount factor [1/(1+1w)'] Present value of horizon FCFF Cum PV of horizon FCFF Present value of terminal FCFF Total firm value Less (plus) NNO Less (plus) NCI Fimm equity value Shares outstanding (millions) Stock price per share