NEED HELP WITH THIS
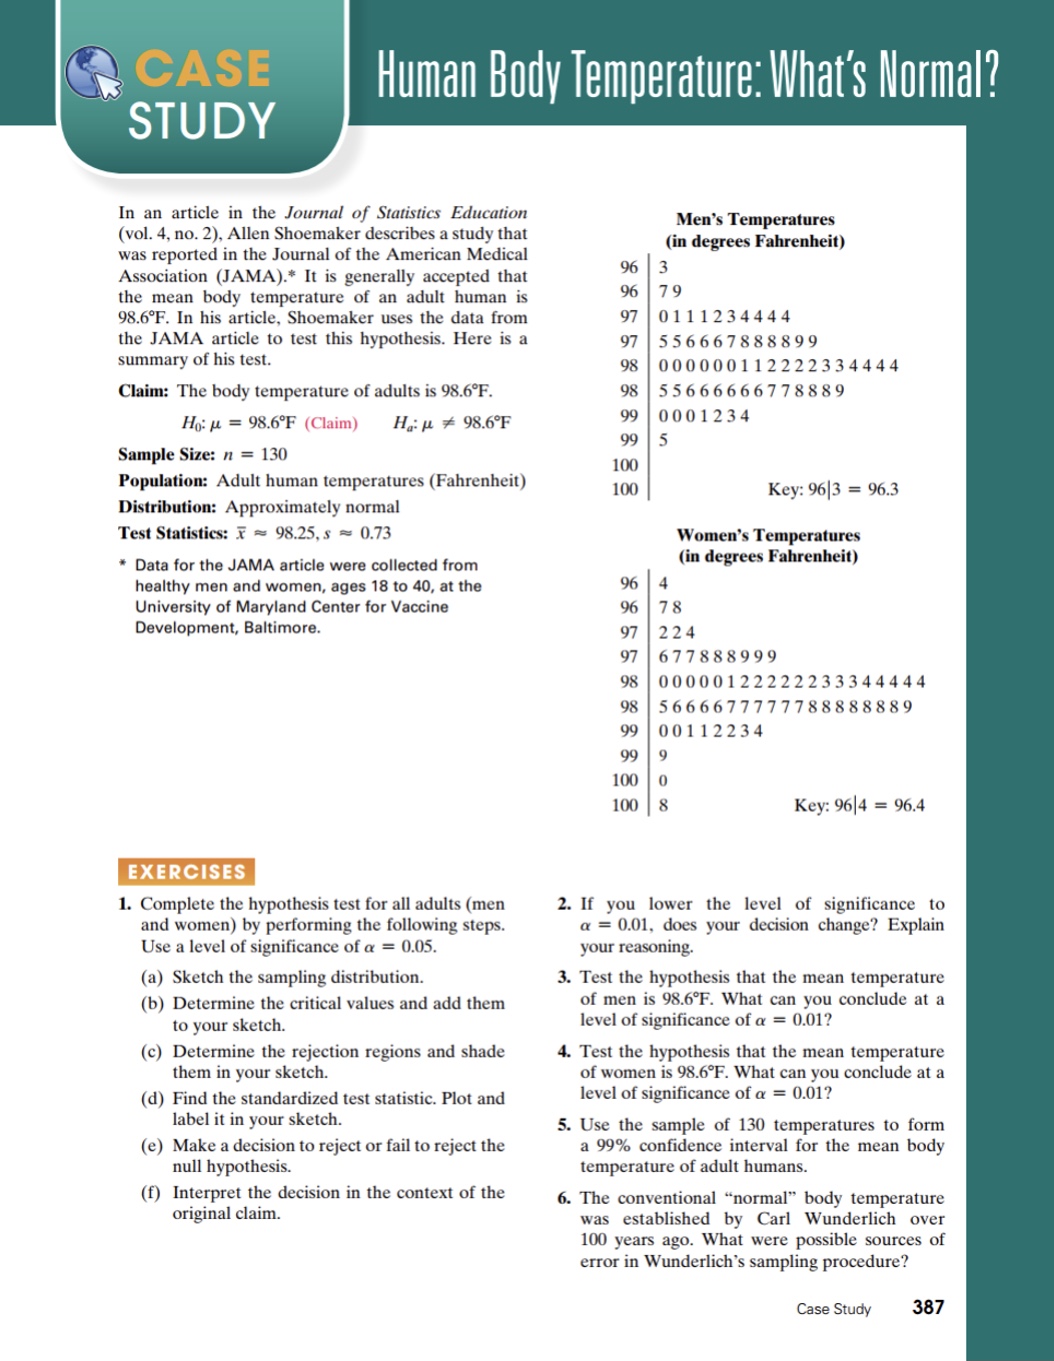
CASE Human Body Temperature: What's Normal? STUDY In an article in the Journal of Statistics Education Men's Temperatures (vol. 4, no. 2), Allen Shoemaker describes a study that (in degrees Fahrenheit) was reported in the Journal of the American Medical Association (JAMA).* It is generally accepted that 96 3 the mean body temperature of an adult human is 96 79 98.6.F. In his article, Shoemaker uses the data from 97 0111234 4 4 4 the JAMA article to test this hypothesis. Here is a 97 556667888899 summary of his test. 98 000000112222334444 Claim: The body temperature of adults is 98.6.F. 98 55666666778889 Ho: M = 98.6.F (Claim) Hail # 98.6.F 99 0001234 99 5 Sample Size: n = 130 100 Population: Adult human temperatures (Fahrenheit) 100 Key: 96|3 = 96.3 Distribution: Approximately normal Test Statistics: X ~ 98.25, s = 0.73 Women's Temperatures * Data for the JAMA article were collected from (in degrees Fahrenheit) healthy men and women, ages 18 to 40, at the 96 4 University of Maryland Center for Vaccine 96 78 Development, Baltimore. 97 224 97 677888999 98 00000122222233344444 98 5666677777788888889 99 00112234 99 9 100 0 100 8 Key: 96 /4 = 96.4 EXERCISES 1. Complete the hypothesis test for all adults (men 2. If you lower the level of significance to and women) by performing the following steps. a = 0.01, does your decision change? Explain Use a level of significance of a = 0.05. your reasoning. (a) Sketch the sampling distribution. 3. Test the hypothesis that the mean temperature (b) Determine the critical values and add them of men is 98.6 F. What can you conclude at a to your sketch. level of significance of a = 0.01? (c) Determine the rejection regions and shade 4. Test the hypothesis that the mean temperature them in your sketch. of women is 98.6 F. What can you conclude at a (d) Find the standardized test statistic. Plot and level of significance of a = 0.01? label it in your sketch. 5. Use the sample of 130 temperatures to form (e) Make a decision to reject or fail to reject the a 99% confidence interval for the mean body null hypothesis. temperature of adult humans. (f) Interpret the decision in the context of the 6. The conventional "normal" body temperature original claim. was established by Carl Wunderlich over 100 years ago. What were possible sources of error in Wunderlich's sampling procedure? Case Study 387


