

Question
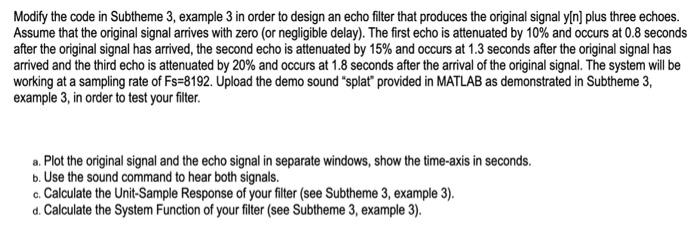
Need help with this programming exercise, will upvote! I will past the requiered code here: % Design an echo filter that produces the original signal
% Design an echo filter that produces the original signal plus two echoes.
% The first echo is attenuated by 20% and occurs at 1 Second.
% The second echo is attenuated by 30% and occurs at 1.5 Seconds.
% System Works at Fs=8192.
close all
clear all
load( 'splat' )
N=length(y); % y is the default name of the uploaded signal
a1=0.8; % 20% attenuation
a2=0.7; % 30% attenuation
td1=1; % time delay 1 in seconds
td2=1.5; % time delay 2 in seconds
Ts=1/Fs; % sampling period
n1= floor(td1/Ts); % time delay 1 in samples
n2= floor (td2/Ts); % time delay 1 in samples
h(1)=1; % unit-sample response coefficients
h(n1)=a1;
h(n2)=a2;
yecho=conv(h,y); % filter output
sound(y, Fs) % Hear the original signal
n=0:length(y)-1;
plot(n*Ts,y);
xlabel( 'seconds' , 'fontsize' ,14)
title( 'Input Signal' , 'fontsize' ,14)
sound(yecho) % Hear the output signal with echoes
figure
n=0:length(yecho)-1;
plot(n*Ts,yecho) % time axis is in seconds
xlabel( 'seconds' , 'fontsize' ,14)
title( 'Output Signal' , 'fontsize' ,14)
Step by Step Solution
There are 3 Steps involved in it
Step: 1

Get Instant Access to Expert-Tailored Solutions
See step-by-step solutions with expert insights and AI powered tools for academic success
Step: 2

Step: 3
Ace Your Homework with AI
Get the answers you need in no time with our AI-driven, step-by-step assistance
Get Started
Graph Database Modeling With Neo4j
Authors: Ajit Singh
2nd Edition
B0BDWT2XLR, 979-8351798783