Need help with this project for calculus providing examples would be great
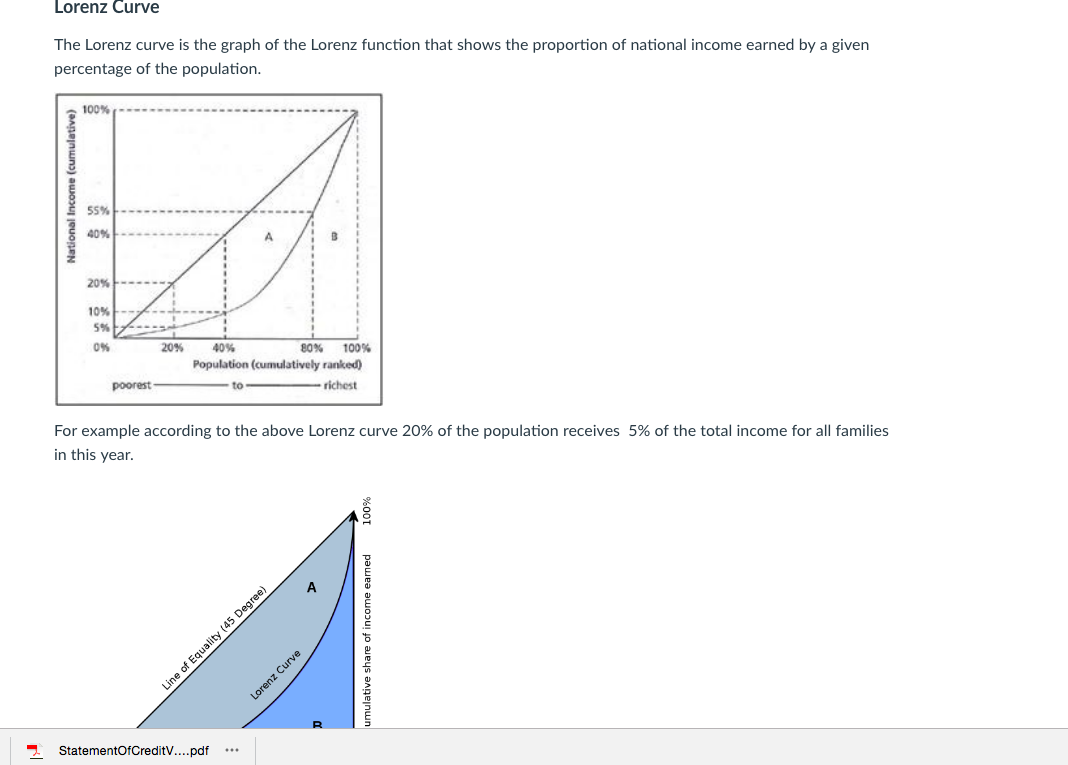
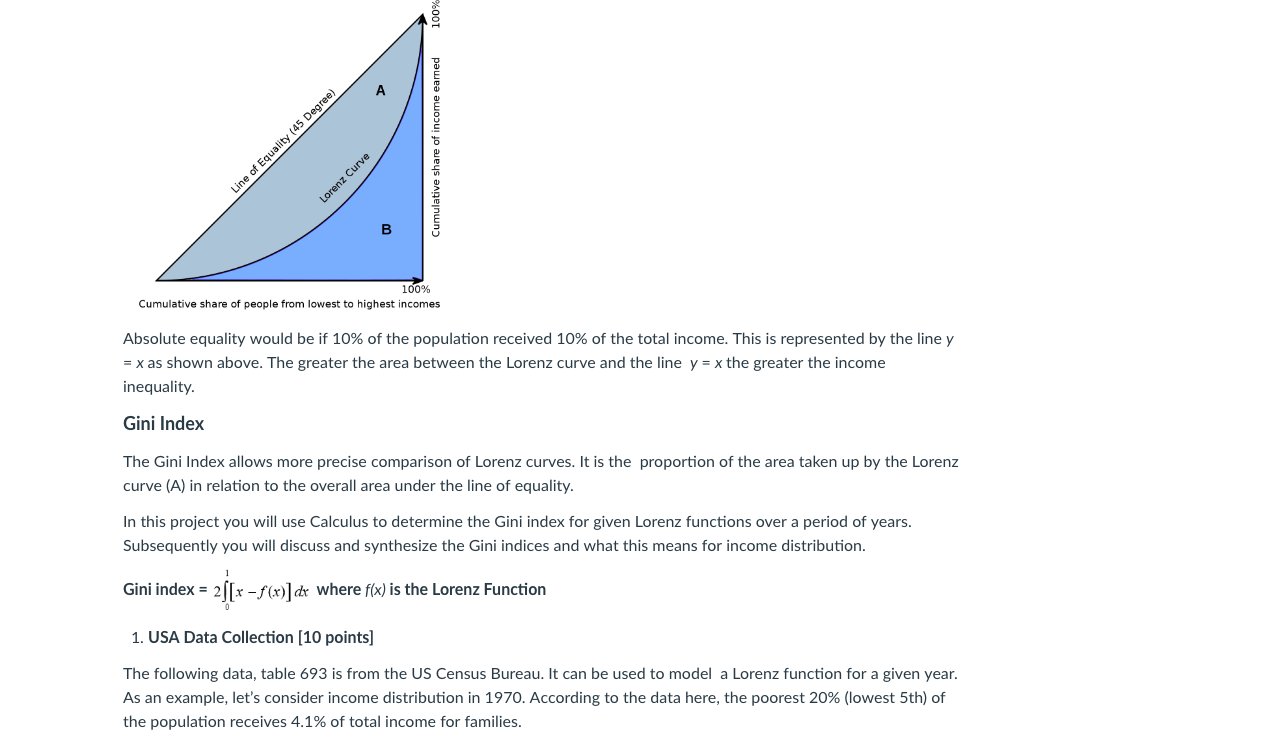
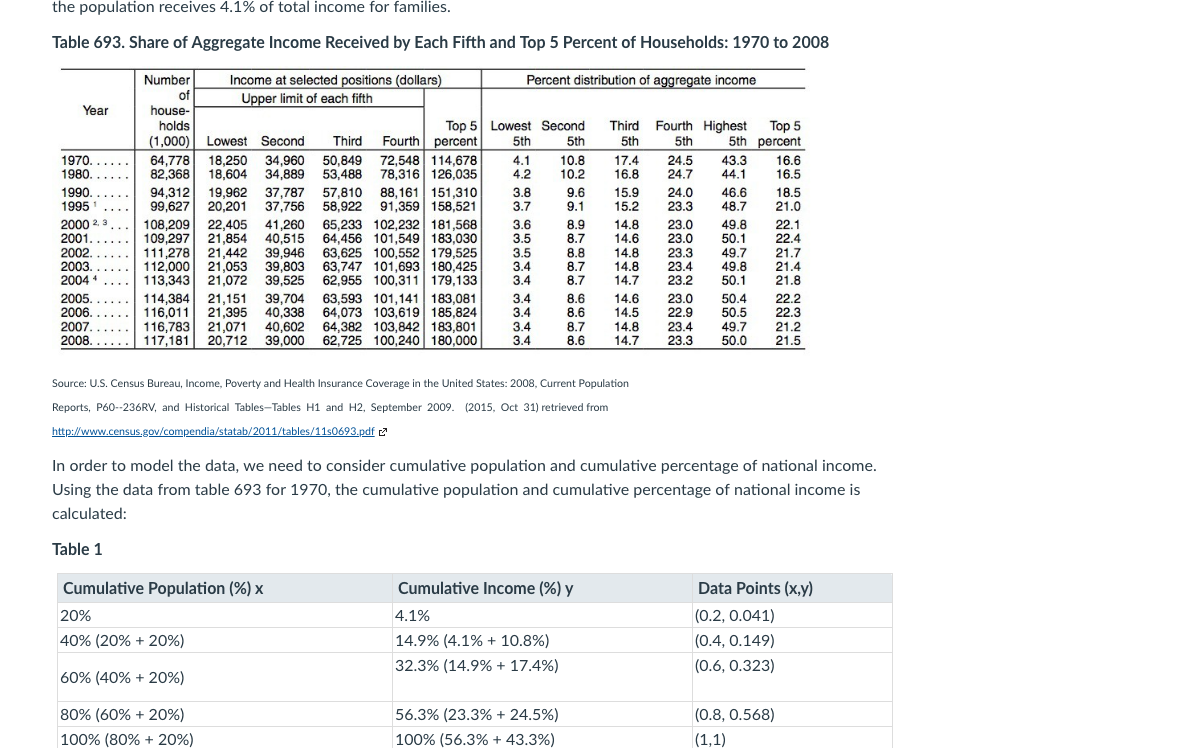
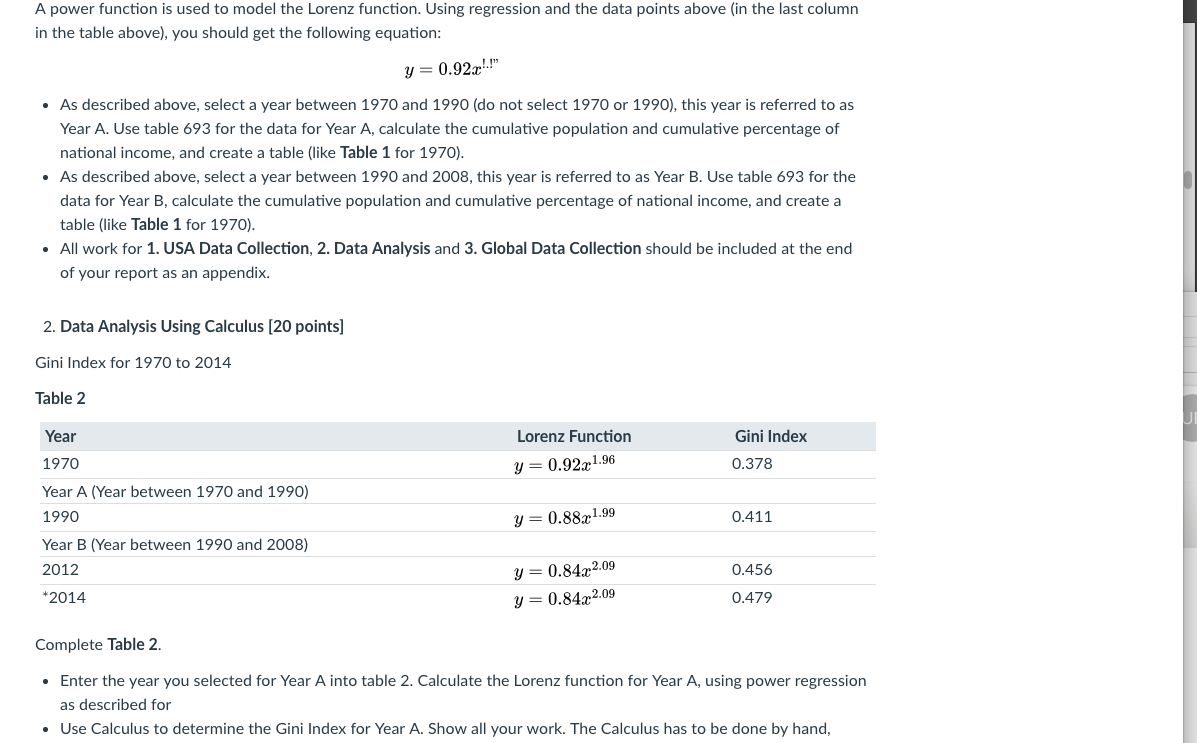
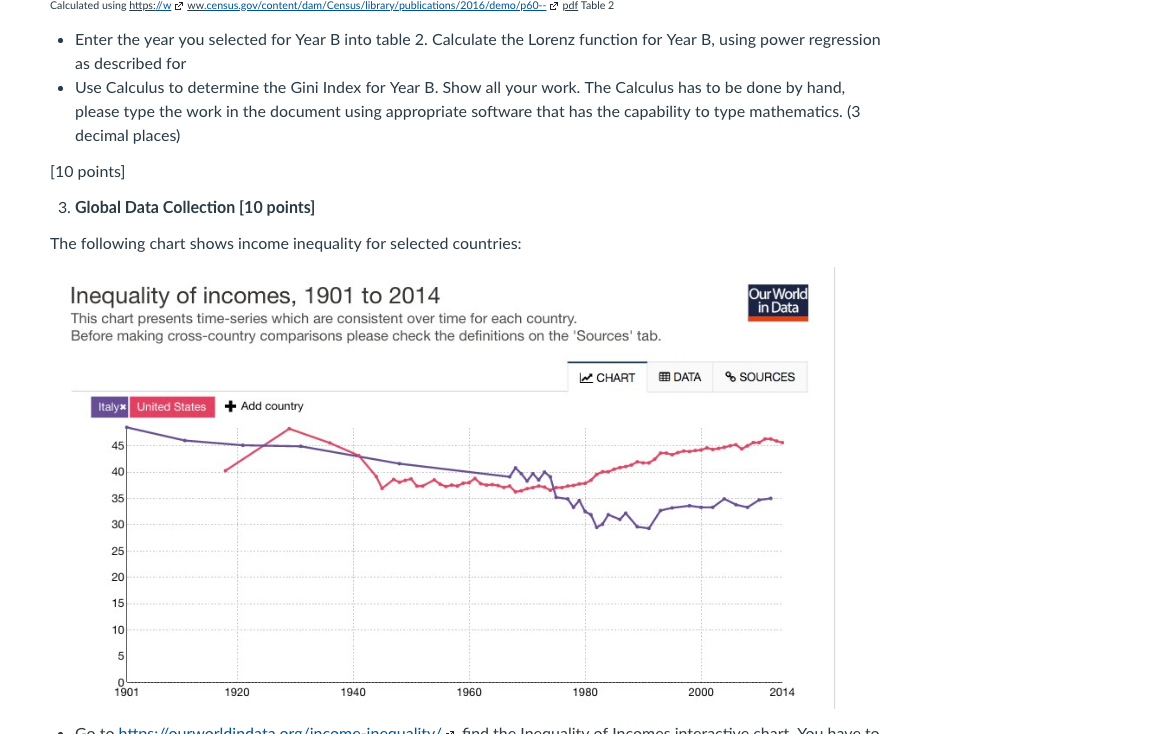
Business Calculus Project In this project you are to present all your results in a r'business report". This report must be typed. The details of your calculus and algebra work that support your results are to be included at the end. This project is worth 100 points. A Global and Business Perspective on Income Inequality Consider yourself a Business analyst consulting for a global social policy research institute as well as for a regional business research institute. In this report you will present the trends of income inequality in America and compare these to trends in two other countries. Use this information and your research to discuss what social policies can be implemented to reduce income inequality in America. You will also discuss income inequality and the impact on businesses. The mathematics involved includes leaming about the Lorenz function, and using calculus to determine the gini index. You will perform data analysis [1. Data Analysis], and global data collection (2. Global Data Collection]. The mathematics is completed rst in order have the information to write the report. The written report should begin with an introduction and the mathematics and graphs and images are embedded to support and illustrate the points made in the writing. Be creative and clear in your reportr choose appropriate headings, and citations. Use additional graphs and/or images for visual impact and for emphasizing your points. Mathematics of Income Inequality Income distribution amongst families is an important economic and social issue that has been brought to the public's attention over the past few years. The U.5 Bureau of the Census has collected and analyzed data for income distribution amongst families. To quantify income distribution economists use Lorenz curves. Economists use the Gini coefcient to compare Lorenz curves over different years or different nations. Lorenz Curve Lorenz Curve The Lorenz curve is the graph of the Lorenz function that shows the proportion of national income earned by a given percentage of the population. i 55\" .v.-.-..---...-- For example according to the above Lorenz curve 20% of the population receives 5% of the total income for all families in this yea r. 100% umulave share of income earned '1\" StatementOtCmdltV....pdt l Cumulative share of incnme earned 1 0% Cumulative shin of people from lowest to nighusi: Incomes Absolute equality would be if 10% of the population received 10% of the total income. This is represented by the line y = x as shown above. The greater the area between the Lorenz curve and the line y = x the greater the income inequality. Gini Index The Gini Index allows more precise comparison of Lorenz curves. It is the proportion of the area taken up by the Lorenz curve {A) in relation to the overall area under the line of equality. In this project you will use Calculus to determine the Gini index for given Lorenz functions over a period of years. Subsequently you will discuss and synthesize the Gini indices and what this means for income distribution. Gini index = zx 7f(x)]r where x) is the Lorenz Function n 1. USA Data Collection [10 points] The following data, table 693 is from the US Census Bureau. It an be used to model a Lorenz function for a given year. As an example, let's consider income distribution in 1970. According to the data here, the poorest 20% (lowest 5th) of the population receives 4.1% of total income for families. the population receives 4.1% of total income for families. Table 693. Share onggregate Income Received by Each Fifth and Top 5 Percent of Households: 1970 to 2003 Income atsabcled ---: cna dolavs Fbmant dish'qunaI =3; =9 = I: income LI-rimilofeachflh Ybar Third Fourth Highest Tops (1.000 Lam Second Thlrd Fouth 51h 51h 5111 percent B4378 50.849 72,548 114.6?8 . 17.4 24.5 43.3 16.8 82,368 . 53.4% T8315 126.035 . 16.8 94,312 5?.810 98,161 151.310 . . 15.9 99,627 58.9% 91.359 158.521 . . 15.2 103209 102.232 181.563 . . 14.8 109.29? 101,549 1%.030 . . 14.6 111278 . 100,552 179.525 . . 14.3 112,000 3 101.893 130.425 . . 14.8 113.343 100.311 179.133 . . 14.?r 114,394 101,141 1%.081 . . 14.3 118,011 103.819 185.824 . . 14.5 115.783 103.842 183.501 . . 14.8 117,191 100,240 183.000 . . 14.? 137513.33 13133.35? 13? :3 wan-too roe-woo (no '4 $6 an-hl E 3-1-4- Source U.S Census Bureau. Income. Poverty and Health insurance Coverage In the United Stata: 2006. Current Population Reports. P60--236RV. and Historical TablesTables H1 and H2, September 2009. {2015. 0:! 311 retrieved from http'ffwwrensus gm:Itnmpendialstataboiiftables{1130693,de [2' In order to model the data, we need to consider cumulative population and cumulative percentage of national income. Using the data from table 693 for 1970, the cumulative population and cumulative percentage of national income is calculated: Table 1 Cumulative Population [961): Cumulative Income [9&1 y Data Points my} 20% 4.1% {0.2, 0.041] 40% (20% + 20%) 14.9% (4.1% + 10.8%) (0.4, 0.149] 32.3% (14.9% + 17.4%] {0.6, 0.323] 60% (40% + 20%) 80% [60% + 20%) 56.3% [23.3% + 24.5%] {0.8, 0.568] 100% (80% + 20%] 100% {56.3% + 43.3%) {1,1} A power function is used to model the Lorenz function. Using regression and the data points above (in the last column in the table above), you should get the following equation: y = 0.92mi!" - As described above, select a year between 1970 and 1990 [do not select 1970 or 1990], this year is referred to as Year A. Use table 693 for the data for Year A, calculate the cumulative population and cumulative percentage of national income, and create a table {like Table 1 for 1970). - As described above, select a year between 1990 and 2008, this year is referred to as Year B. Use table 693 for the data for Year B, calculate the cumulative population and cumulative percentage of national income, and create a table (like Table 1 for 1970). - All work for 1. USA Data Collection, 2. Data Analysis and 3. Global Data Collection should be included at the end of your report as an appendix. 2. Data Analysis Using Calculus [20 points] Gini Index for 1970 to 2014l Table 2 Year Lorenz Function 1970 y = 0.923136 Year A [Year between 1970 and 1990] 1990 y : 0.883139 Year E {Year between 1990 and 2008} 2012 y = 0.843239 *2014 y = 0.843239 Complete Table 2. Gini Index 0.378 0.411 0.456 0.479 - Enter the year you selected for Year A into table 2. Calculate the Lorenz function for Year A, using power regression as described for - Use Calculus to determine the Gini Index for Year A. Show all your work. The Calculus has to be done by hand, Camrlated using hupsz'w r3 ww.cemusgmr'contenti'damr'Census.u'librarygpuhllcanonsfzmofdemofpoo- r3} pdf Table 2 . Enter the year you selected for Year B into table 2. Calculate the Lorenz function for Year B, using power regression as described for . Use Calculus to determine the Gini Index for Year B. Show all your work. The Calculus has to be done by hand, please type the work in the document using appropriate software that has the capability to type mathematics. {3 decimal places) [10 points] 3. Global Data Collection [10 points] The following chart shows income inequality for selected countries: Inequality of incomes, 1901 to 2014 This chart presents timeseries which are consistent over time for each country Before making crossecountry comparisons please check the denitions on the 'Souroes' tab. HES-MET BOAT)! o EDUFIGES H mm 1901 1920 19\"} 1%!) 1990 20m: 2114 - CA in Inn-u.- {IA-.nunulrlind-wn Aunlinpnmnjnnnu-'Iunn .3. And it. Innnllnlihi A: Inl'nmnr intnu-IIIHIIA '4'\"... Va... Inmm tn . Countries can be added by selecting + Add country . Click on DATA, download the excel le, inequality-of-incomes-chartbook.csv. . Open the excel file and find the GINI index for the two countries you selected other than the USA. make a note of the GINI index for 19w (or closest year available), Year B {as above) and 2014. Put this information in a table. One table can be used for both countries, or a table for each country. [10 points] Source: Our World in Data, h_ttps:./[oun~orldindata.orge 4. Writing Business Report -- Economic and Business Discussion [60 points] You are a Business analyst consulting for a global social policy research institute as well as for a regional business research institute. Use the following to write your business report; 1. Data Collection 2. Data Analysis 3. Global Data Collection 4. Research on Income inequality In this section everything that should be addressed in the report is outlined. Be creative and clear in your report, choose appropriate headingsr and citations. Use additional graphs and/or images for visual impact and for emphasizing your points. Introduction Write one to two paragraphs explaining income inquality. Dene what income inequality means. Explain how it is quantied by economists using the Lorenz curve and the Gini index. Be sure to explain what the Lorenz function and Gini index are. Include diagrams or images that may be helpful. [72'r points] In your explanation include the following Absolute Equality} Inequality -|-------- : ------------ ----u ---- -- --- -- - - -- ---- ----- Gini index are. Include diagrams or images that may be helpful. [7 points] In your explanation include the following Absolute Equality} Inequality Absolute equality is indicated by a Gini index value of Absolute inequality is indicated by a Gini index value of [3 points] mphical Representation USA . Include your completed table 2 (from Data Analysis} [1 point] __ __._ __ __.r._... __._.._ __._ __._.._ __..__._.. _..._. . Interpret the meaning of this Gini index . Interpret the meaning of this Gini index . Use appropriate technology to create one graph of the Lorenz function and the line of equality on the same set of axes for the following years: Ensure that the graph is clearly labeled with a title. a 1970 u YearB o 2014 [5 points] G LO BAL . Embed the time series graph of the USA and the two countries you selected from the website h_ttps:{20urworldindata.org.{ or create your own graph with this information. Add an appropriate specic tittle to the [4 points] Income Inequality - How Does the USA Compare Globally? no. menu...- sluuPJ. um... n..u...-..uc.u...1 um... u\". "n... s. aPPIuPI mu... [10 points] Technology Considerations Discuss what technology you chose for modeling and graphing Lorenz functions and why these technologies were chosen. Also include any websites that you used to obtain information in regards to this project. What other technologies could you have considered for this project that were not used? Indicate why you decided not to use these technologies. [5 points] Professional Report With College Level Writing and References Your report should be professionally written; that is, it should be well organized. easy to decipher with correct grammarr spelling and punctuation. Please note. this is a report. appropriate headings should be used. The report should be written for a general audience, that is someone who is not taking a Business Calculus course would be able to read the report and understand it. This document should not be submitted with the answers under each question. You should be comfortable submitting this report to your boss and feel condent presenting your report in a business meeting or professional conference. Be creative with the report. There should be a minimum of three references; they should be in APA format. [10 points]
