Need help with three questions...........question 1, 5.5 and 5.6
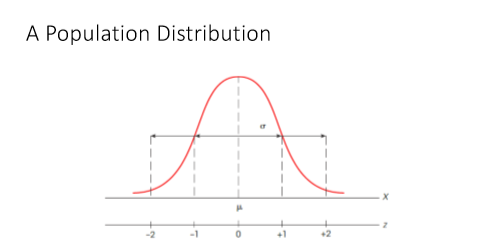
1.Draw a picture like Figure 5.3 on p.135 showing the relationship among z-score values, the mean, and the standard deviation;
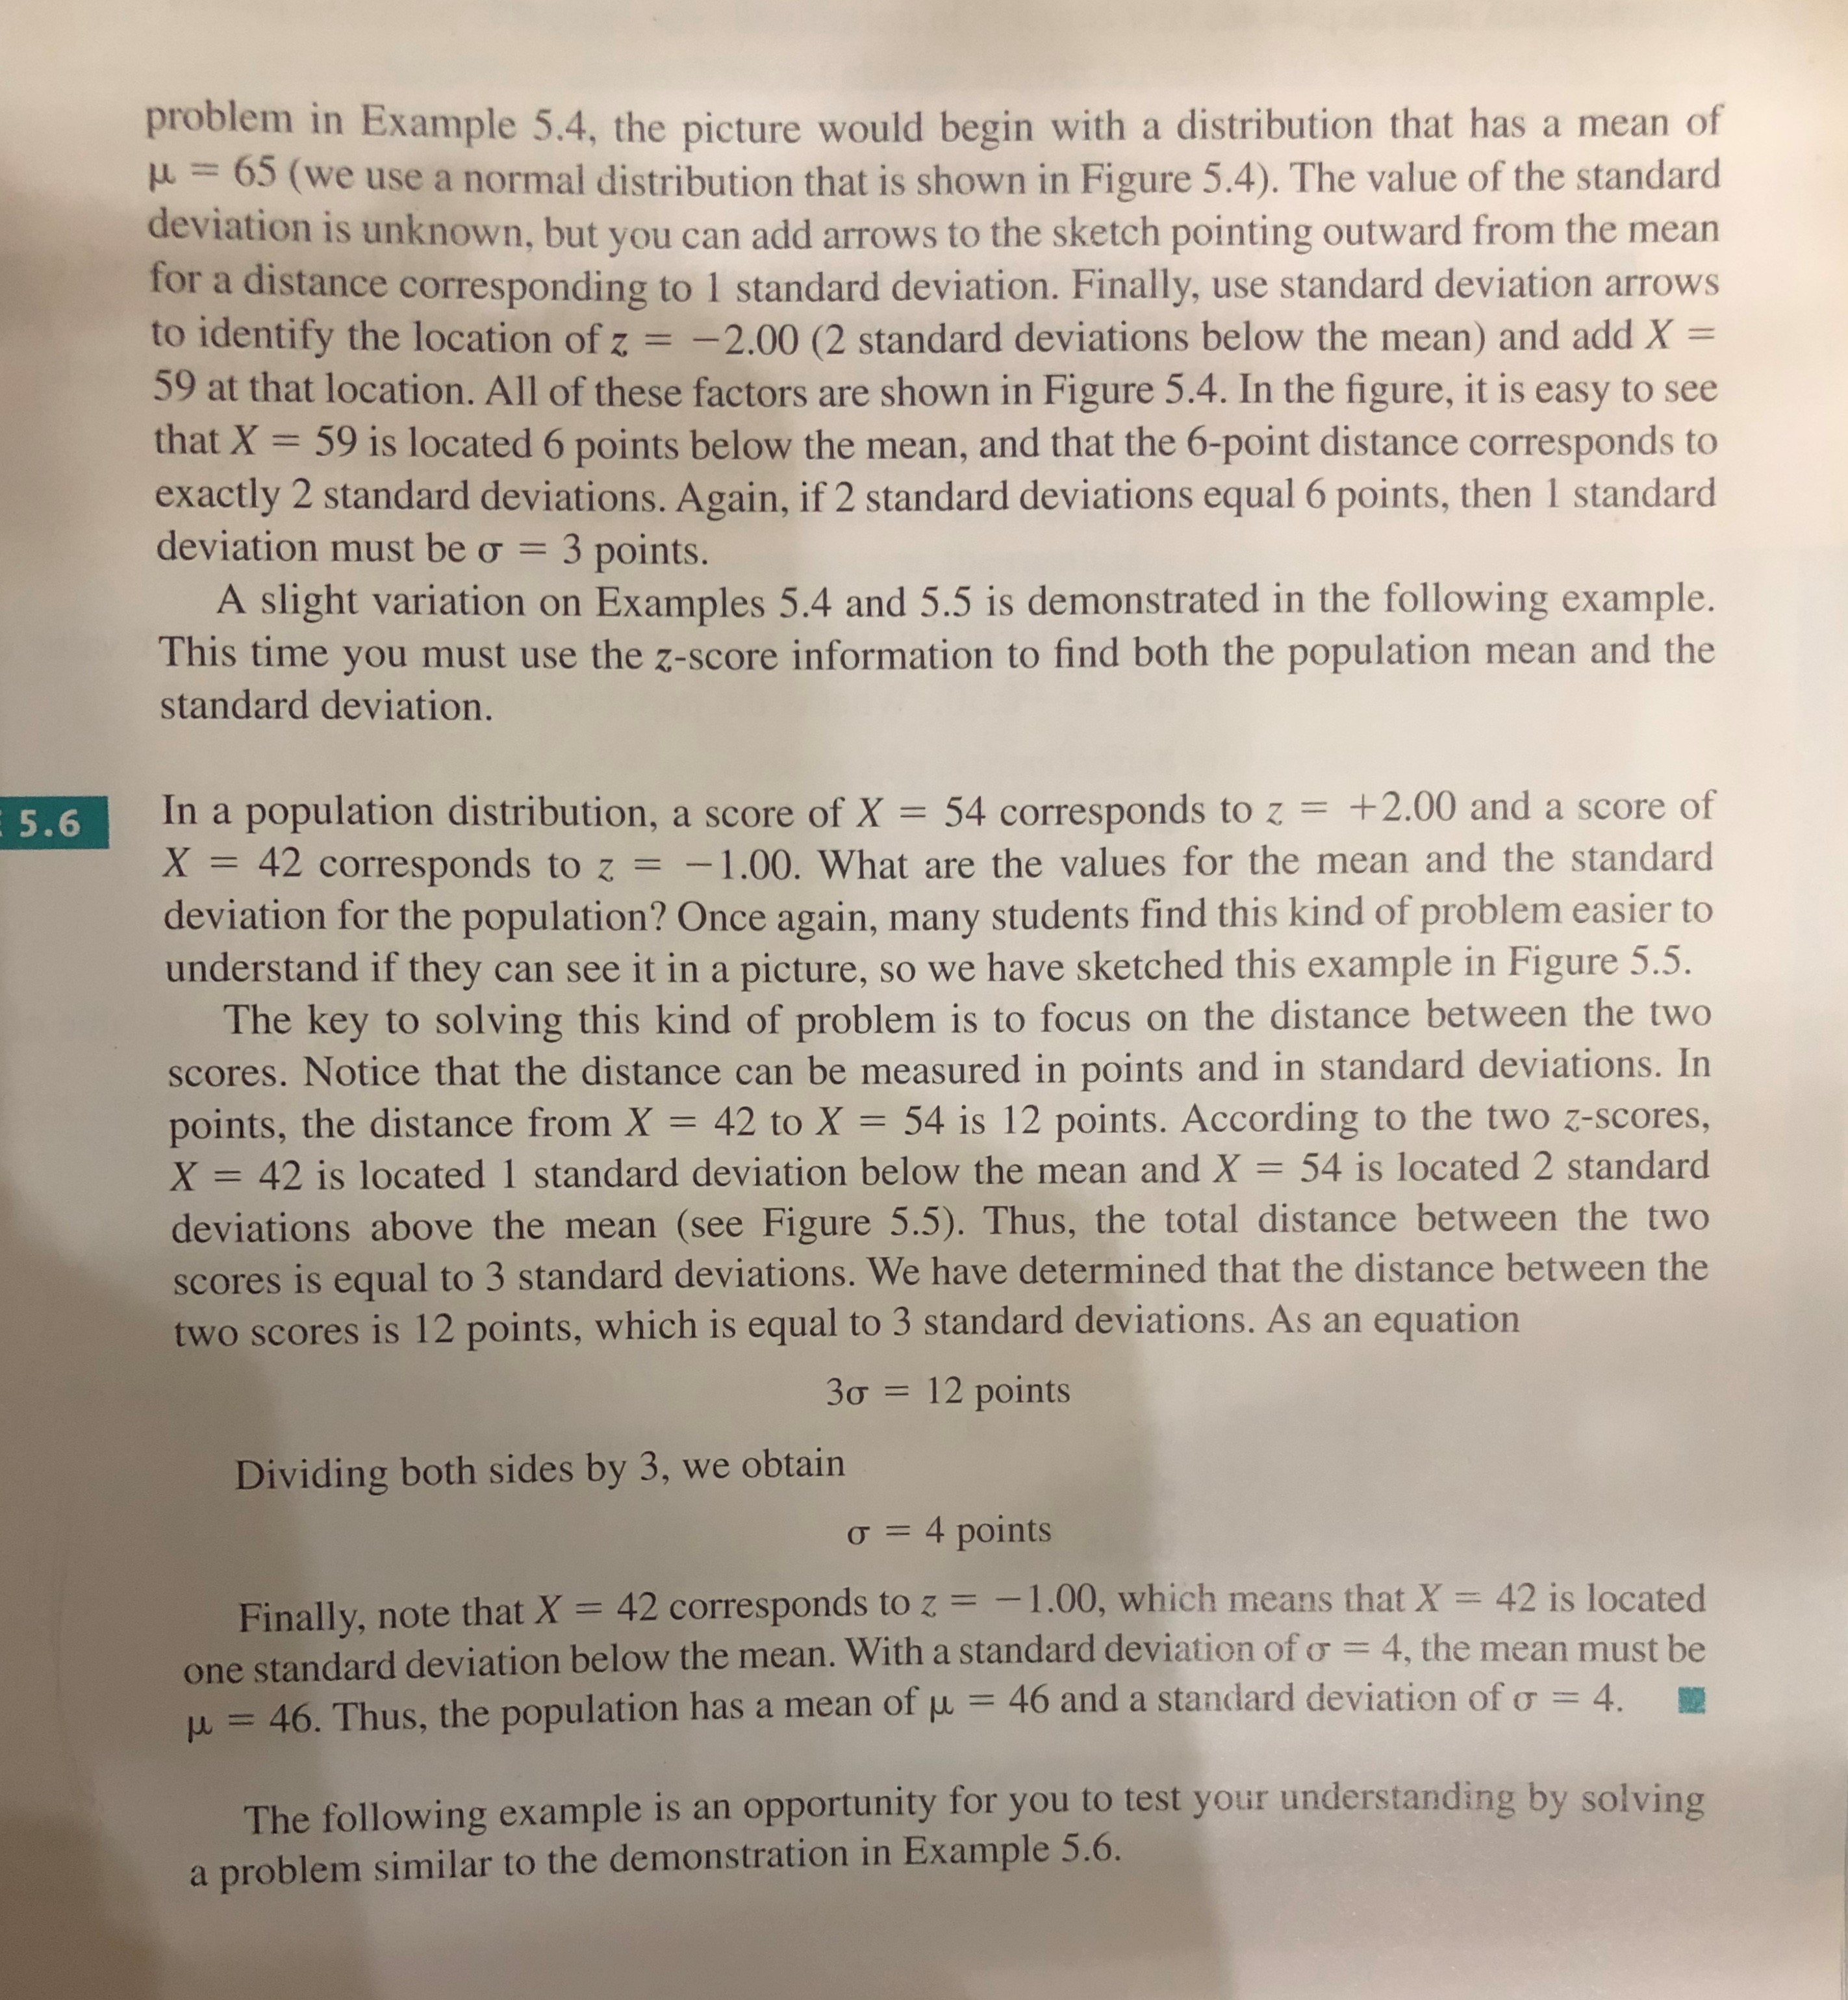
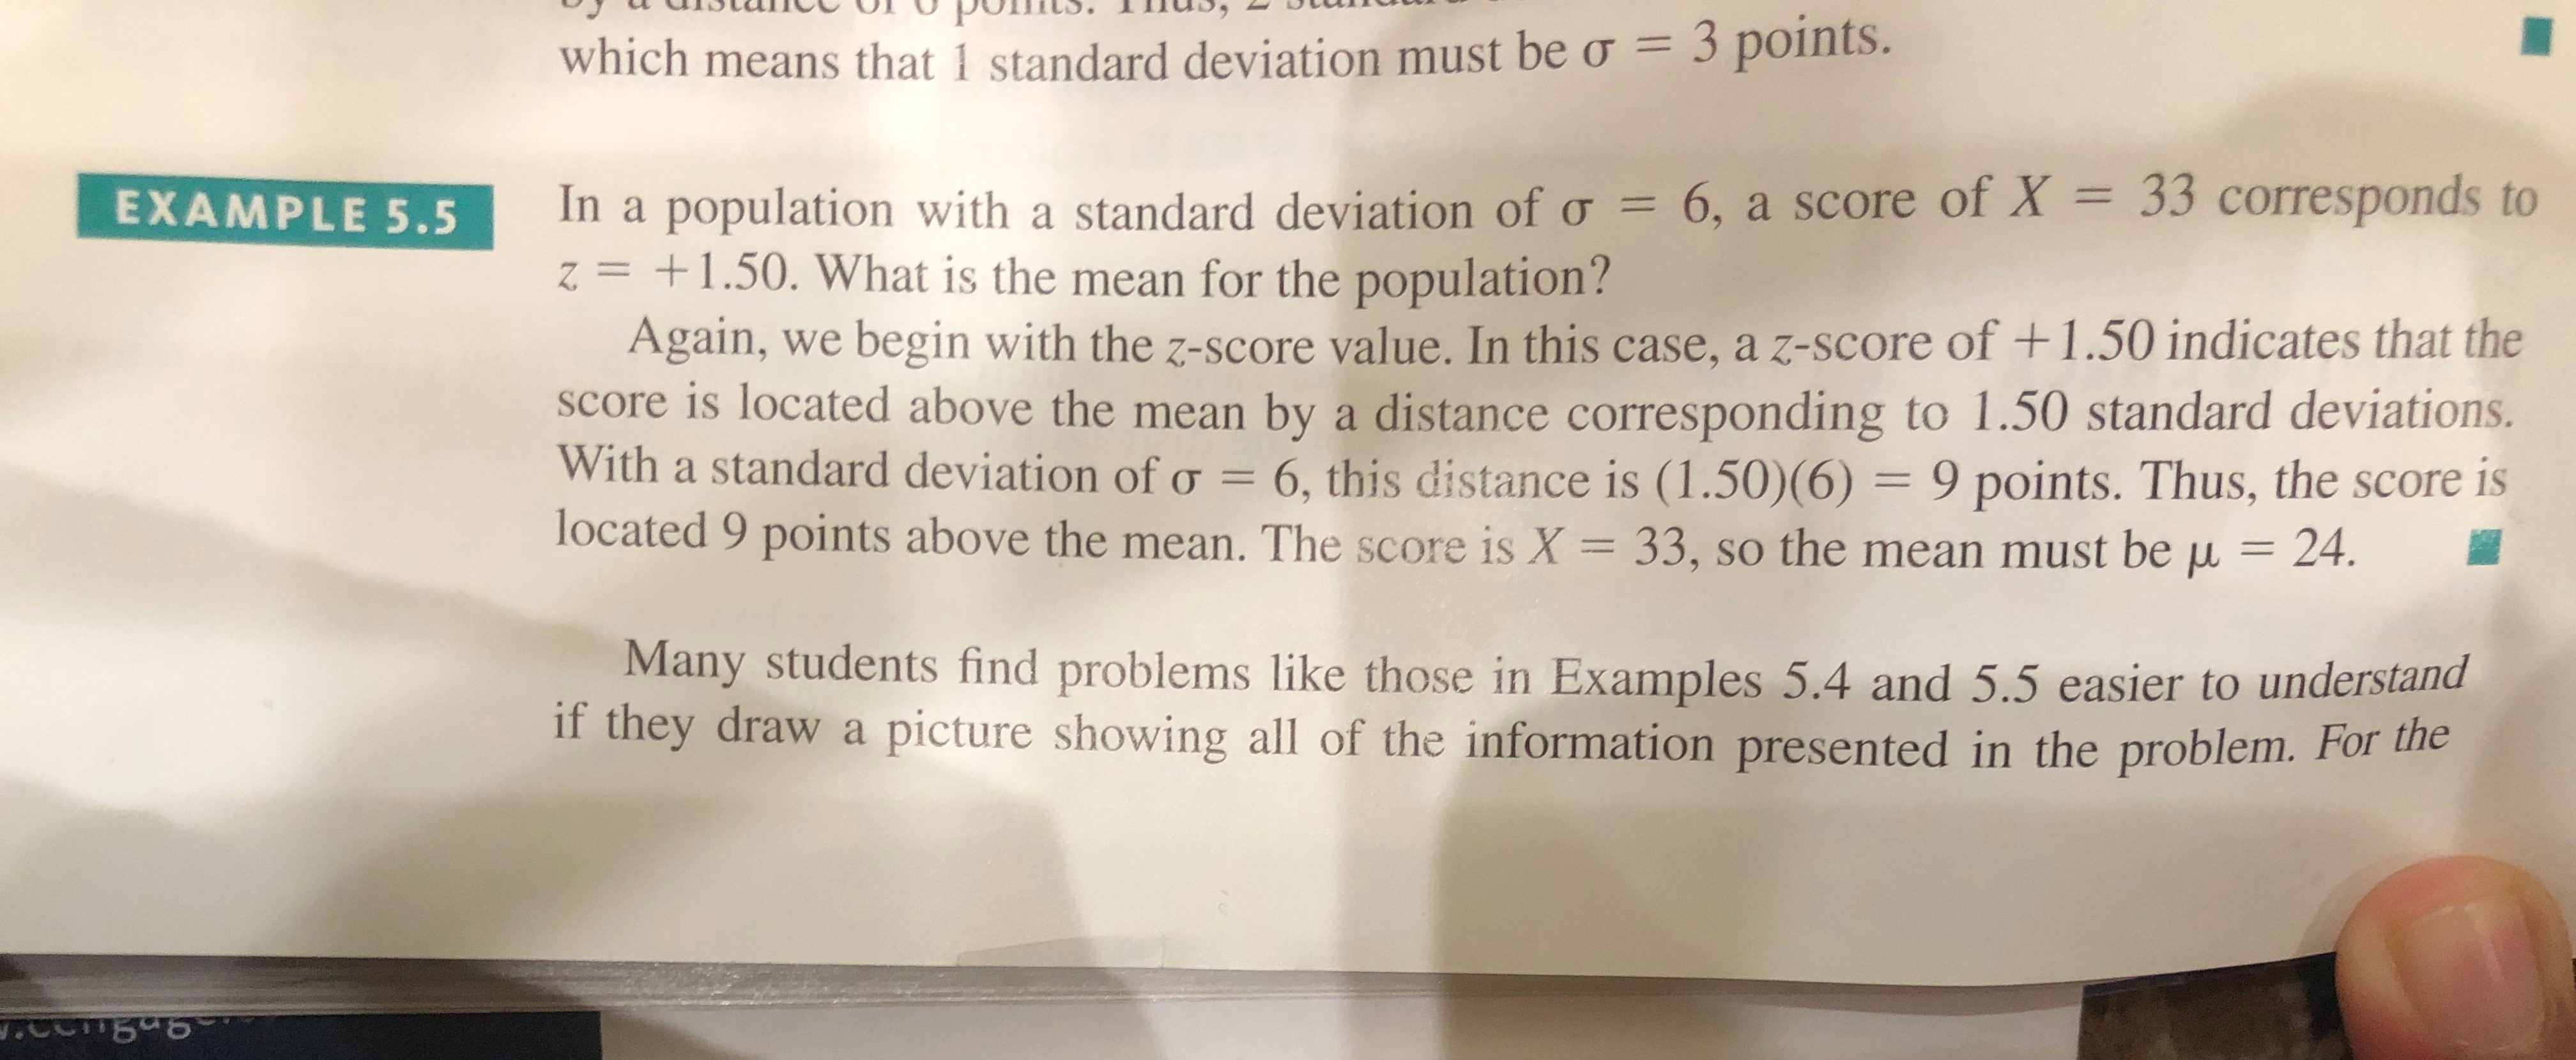
problem in Example 5.4, the picture would begin with a distribution that has a mean of u = 65 ( we use a normal distribution that is shown in Figure 5.4). The value of the standard deviation is unknown, but you can add arrows to the sketch pointing outward from the mean for a distance corresponding to 1 standard deviation. Finally, use standard deviation arrows to identify the location of z = -2.00 (2 standard deviations below the mean) and add X = 59 at that location. All of these factors are shown in Figure 5.4. In the figure, it is easy to see that X = 59 is located 6 points below the mean, and that the 6-point distance corresponds to exactly 2 standard deviations. Again, if 2 standard deviations equal 6 points, then 1 standard deviation must be o = 3 points. A slight variation on Examples 5.4 and 5.5 is demonstrated in the following example. This time you must use the z-score information to find both the population mean and the standard deviation. 5.6 In a population distribution, a score of X = 54 corresponds to z = +2.00 and a score of X = 42 corresponds to z = -1.00. What are the values for the mean and the standard deviation for the population? Once again, many students find this kind of problem easier to understand if they can see it in a picture, so we have sketched this example in Figure 5.5. The key to solving this kind of problem is to focus on the distance between the two scores. Notice that the distance can be measured in points and in standard deviations. In points, the distance from X = 42 to X = 54 is 12 points. According to the two z-scores, X = 42 is located 1 standard deviation below the mean and X = 54 is located 2 standard deviations above the mean (see Figure 5.5). Thus, the total distance between the two scores is equal to 3 standard deviations. We have determined that the distance between the two scores is 12 points, which is equal to 3 standard deviations. As an equation 30 = 12 points Dividing both sides by 3, we obtain o = 4 points Finally, note that X = 42 corresponds to z = -1.00, which means that X = 42 is located one standard deviation below the mean. With a standard deviation of of = 4, the mean must be u = 46. Thus, the population has a mean of u = 46 and a standard deviation of o = 4. The following example is an opportunity for you to test your understanding by solving a problem similar to the demonstration in Example 5.6.which means that I standard deviation must be o = 3 points . In a population with a standard deviation of ` = 6, a score of * = 33 corresponds to 2 = + 1. 50. What is the mean for the population ?! Again , we begin with the z- score value . In this case , a 2- score of + 1.50 indicates that the score is located above the mean by a distance corresponding to 1.50 standard deviations . With a standard deviation of ` = 6 , this distance is ( 1. 50 ) ( 6 ) = 9 points . Thus , the score is located 9 points above the mean . The score is * = 33, so the mean must be u = 24 . Many students find problems like those in Examples 5. 4 and 5.5 easier to understand if they draw a picture showing all of the information presented in the problem . For the\f