Need help writing a shareholder report about the capstone simulation with the following format.
1. Executive Summary 2. Examination 3. Relevance 4. Impact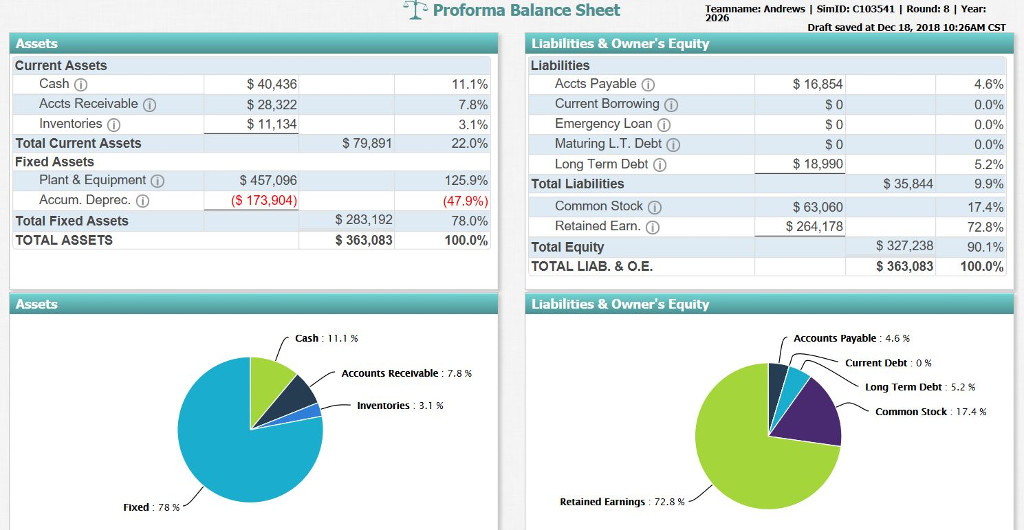
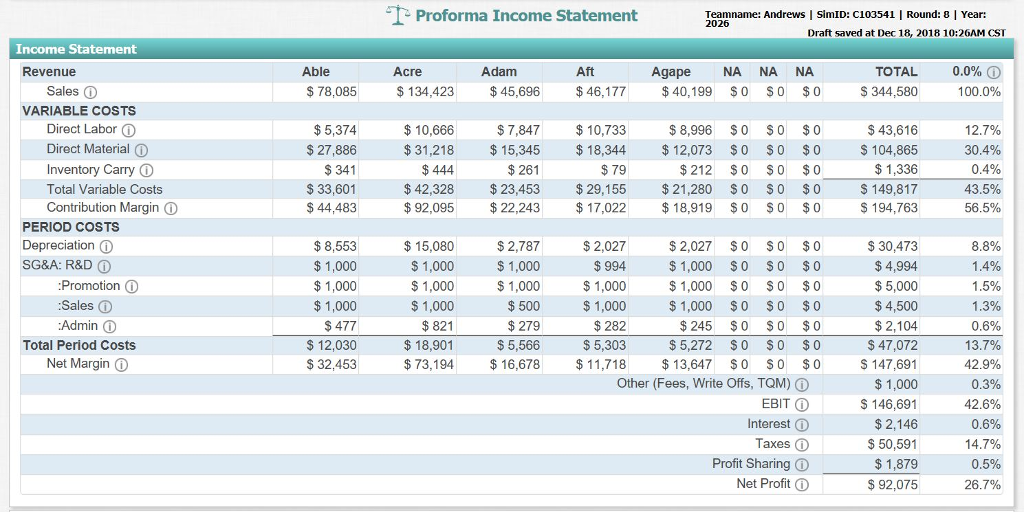
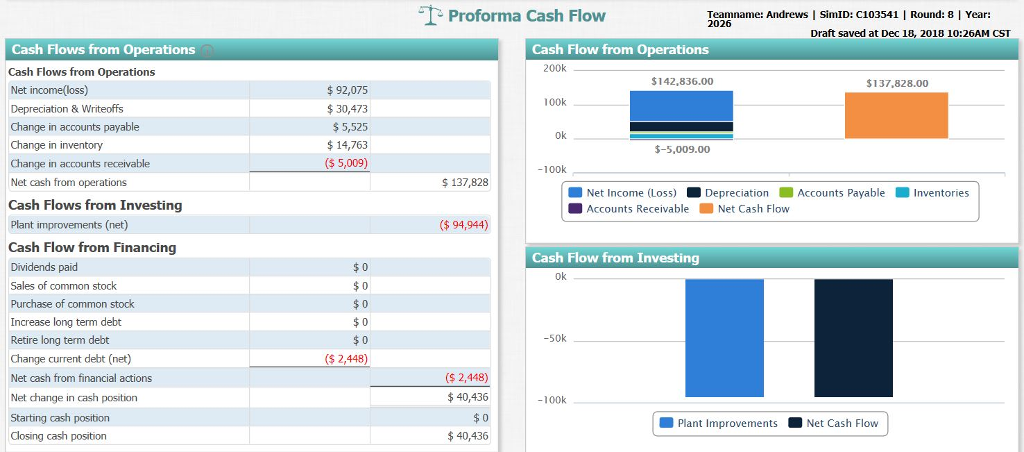
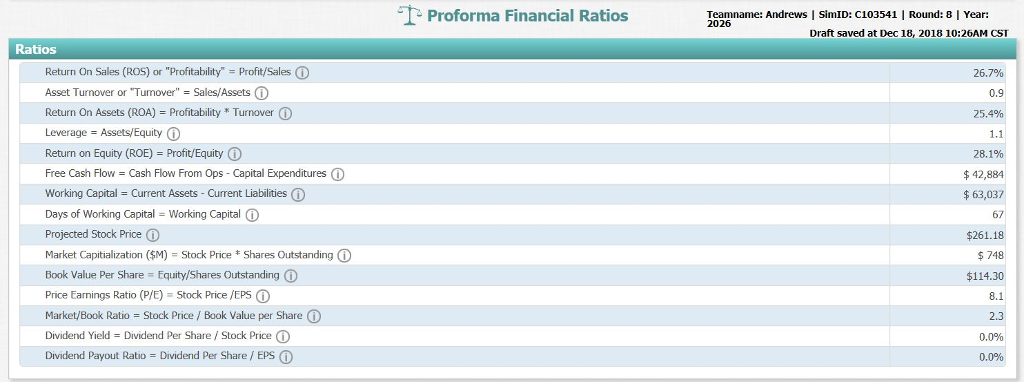
Proforma Balance Sheet Team name: Andrews l Sim ID: C103541 2026 Round: 8 Year: Draft saved at Dec 18, 2018 10:2 CST Liabilities & Owner's Equity Liabilities Current Assets $ 16,854 S 0 4.6% 0.0% 0.0% 0.0% 5.2% 9.9% 17.4% 728% 90.1% 100.0% Cash Accts Receivable O Inventories $40,436 $ 28,322 $11,134 7 8% 3.1% 220% Accts Payable Current Bormrowing Emergency Loan Maturing L.T. Debt O Long Term Debt( 79,891 Total Current Assets Fixed Assets $18,990 Plant & Equipment Accum. Deprec. $ 457,096 (S 173,904) 125.9% (47.9%) 78.0% 100.0% Total Liabilities 35,844 | Common Stock Total Fixed Assets TOTAL ASSETS $ 283,192 363,083 $ 63,060 $ 264,178 Retained Earn. Total Equity TOTAL LIAB. & O.E $327,238 $363,083 Liabilities & Owner's Equity Cash: 11.1 % Accounts Payable : 4.6% Current Debt : 0 % Accounts Receivable: 7.8% Long Term Debt : 5.2 % -Inventories : 3.1 % Common Stock : 1 7.4 % Retained Earnings: 72.8% fixed: 78% Proforma Income Statement Teamname: Andrews | SimID: C103541 Round: 8 Year: 2026 Draft saved at Dec 18, 2018 10:26AM CST Income Statement Revenue Able Acre Adam Agape NA NA NA 0.0% TOTAL S 344,580 $78,085 $134,423 $45,696$46,177 $40,199 $0 S0 $0 100.0% VARIABLE COSTS Direct Labor Direct Material Inventory Carry O Total Variable Costs Contribution Margin O $5,374 $ 27,886 $ 341 $ 33,601 $ 44,483 $10,666 $7,847 10,733 12.7% 30.4% $ 8,996 S0 S0 $0 $31,218 15,345 $ 18,344 12,073 $0 S0 $0 $212 $0 S0 $0 $42,328 23,453 $29,155 $21,280 $0 S0 $0 $92,095$22,243$17,022$18,919 $0 S0 $0 $ 43,616 104,865 $1,336 S 149,817 $ 194,763 $444 $ 261 43.5% 56.5% PERIOD COSTS Depreciation SG&A: R&D $ 8,553 $1,000 $1,000 $1,000 $ 2,787 $1,000 $1,000 $500 $279 $5,566 $73,194$16,678 $2,027 $994 $1,000 $1,000 $ 30,473 $ 4,994 $5,000 $4,500 $2,104 $ 47,072 147,691 $1,000 S 146,691 $ 2,146 $ 50,591 $1,879 $ 92,075 $15,080 $ 1,000 $ 1,000 $1,000 $ 821 $18,901 $2,027 S0 S0 $0 $1,000 S0 S0 $0 $1,000 S0 S0 $0 $1,000 $0 S0 $0 $245 $0 S0 $0 $5,272 S0 S0 $0 $11,718$13,647S0 S0$0 8.8% Promotion O Sales Admin Total Period Costs Net Margin $282 $ 12,030 $ 32,453 0.6% 13.7% 42.9% $ 5,303 Other (Fees, Write Offs, TQM) O EBIT O 42.6% Interest axes Profit Sharing 14.7% 0.5% 267% Net Profit Proforma Cash Flow Teamname: Andrews 2026 SmID: C103541 | Round: 8 | Year: Draft saved at Dec 18, 2018 10:2 CST Cash Flows from Operations Cash Flows from Operations Net income(loss) Depreciation & Writeoffs Change in accounts payable Change in inventory Change in accounts receivable Net cash from operations Cash Flows from Investing Plant improvements (net) Cash Flow fro Dividends paid Sales of common stock Purchase of common stock Increase long term debt Retire long term debt Change current debt (net) Net cash from financial actions Net change in cash position Starting cash position Closing cash position Cash Flow from Operations 200k $142,836.00 $137,828.00 $92,075 $30,473 5,525 $14,763 ($ 5,009) 100k_ ok $-5,009.00 -100k 137,828 Net Income (Loss) Depreciation Accounts Payable Inventories Accounts Receivable Net Cash Flow $94,944) m Financing Cash Flow from Investing ok 50k $ 2,448) $ 2,448) 40,436 -100k Plant Improvements Net Cash Flow 40,436 TProforma Financial Ratios Teamname: Andrews | SimID: C103541 |Round: 8 Year: 2026 Draft saved at Dec 18, 2018 10:26AM CST Return On Sales (ROS) or "Profitability" Profit/Sales Asset Turnover or "Turnover" = Sales/Assets Return On Assets (ROA) Profitability* Turnover O Leverage = Assets/Equity Return on Equity (ROE) = Profit/Equity Free Cash Flow Cash Flow From Ops - Capital Expenditures O Working Capital Current Assets - Current Liabilities O Days of Working Capital Working Capital Projected Stock Price Market Capitialization ($M) Stock Price Shares Outstanding Book Value Per Share Equity/Shares Outstanding Price Earnings Ratio (PE)-Stock Price /EPS Market/Book Ratio = Stock Price / Book Value per Share Dividend Yield = Dividend Per Share / Stock Price Dividend Payout Ratio = Dividend Per Share / EPS 26.7% 0.9 25.496 28.1% 42,884 63,037 67 $261.18 $ 748 $114.30 8.1 2.3 0.0% 0.0% Proforma Balance Sheet Team name: Andrews l Sim ID: C103541 2026 Round: 8 Year: Draft saved at Dec 18, 2018 10:2 CST Liabilities & Owner's Equity Liabilities Current Assets $ 16,854 S 0 4.6% 0.0% 0.0% 0.0% 5.2% 9.9% 17.4% 728% 90.1% 100.0% Cash Accts Receivable O Inventories $40,436 $ 28,322 $11,134 7 8% 3.1% 220% Accts Payable Current Bormrowing Emergency Loan Maturing L.T. Debt O Long Term Debt( 79,891 Total Current Assets Fixed Assets $18,990 Plant & Equipment Accum. Deprec. $ 457,096 (S 173,904) 125.9% (47.9%) 78.0% 100.0% Total Liabilities 35,844 | Common Stock Total Fixed Assets TOTAL ASSETS $ 283,192 363,083 $ 63,060 $ 264,178 Retained Earn. Total Equity TOTAL LIAB. & O.E $327,238 $363,083 Liabilities & Owner's Equity Cash: 11.1 % Accounts Payable : 4.6% Current Debt : 0 % Accounts Receivable: 7.8% Long Term Debt : 5.2 % -Inventories : 3.1 % Common Stock : 1 7.4 % Retained Earnings: 72.8% fixed: 78% Proforma Income Statement Teamname: Andrews | SimID: C103541 Round: 8 Year: 2026 Draft saved at Dec 18, 2018 10:26AM CST Income Statement Revenue Able Acre Adam Agape NA NA NA 0.0% TOTAL S 344,580 $78,085 $134,423 $45,696$46,177 $40,199 $0 S0 $0 100.0% VARIABLE COSTS Direct Labor Direct Material Inventory Carry O Total Variable Costs Contribution Margin O $5,374 $ 27,886 $ 341 $ 33,601 $ 44,483 $10,666 $7,847 10,733 12.7% 30.4% $ 8,996 S0 S0 $0 $31,218 15,345 $ 18,344 12,073 $0 S0 $0 $212 $0 S0 $0 $42,328 23,453 $29,155 $21,280 $0 S0 $0 $92,095$22,243$17,022$18,919 $0 S0 $0 $ 43,616 104,865 $1,336 S 149,817 $ 194,763 $444 $ 261 43.5% 56.5% PERIOD COSTS Depreciation SG&A: R&D $ 8,553 $1,000 $1,000 $1,000 $ 2,787 $1,000 $1,000 $500 $279 $5,566 $73,194$16,678 $2,027 $994 $1,000 $1,000 $ 30,473 $ 4,994 $5,000 $4,500 $2,104 $ 47,072 147,691 $1,000 S 146,691 $ 2,146 $ 50,591 $1,879 $ 92,075 $15,080 $ 1,000 $ 1,000 $1,000 $ 821 $18,901 $2,027 S0 S0 $0 $1,000 S0 S0 $0 $1,000 S0 S0 $0 $1,000 $0 S0 $0 $245 $0 S0 $0 $5,272 S0 S0 $0 $11,718$13,647S0 S0$0 8.8% Promotion O Sales Admin Total Period Costs Net Margin $282 $ 12,030 $ 32,453 0.6% 13.7% 42.9% $ 5,303 Other (Fees, Write Offs, TQM) O EBIT O 42.6% Interest axes Profit Sharing 14.7% 0.5% 267% Net Profit Proforma Cash Flow Teamname: Andrews 2026 SmID: C103541 | Round: 8 | Year: Draft saved at Dec 18, 2018 10:2 CST Cash Flows from Operations Cash Flows from Operations Net income(loss) Depreciation & Writeoffs Change in accounts payable Change in inventory Change in accounts receivable Net cash from operations Cash Flows from Investing Plant improvements (net) Cash Flow fro Dividends paid Sales of common stock Purchase of common stock Increase long term debt Retire long term debt Change current debt (net) Net cash from financial actions Net change in cash position Starting cash position Closing cash position Cash Flow from Operations 200k $142,836.00 $137,828.00 $92,075 $30,473 5,525 $14,763 ($ 5,009) 100k_ ok $-5,009.00 -100k 137,828 Net Income (Loss) Depreciation Accounts Payable Inventories Accounts Receivable Net Cash Flow $94,944) m Financing Cash Flow from Investing ok 50k $ 2,448) $ 2,448) 40,436 -100k Plant Improvements Net Cash Flow 40,436 TProforma Financial Ratios Teamname: Andrews | SimID: C103541 |Round: 8 Year: 2026 Draft saved at Dec 18, 2018 10:26AM CST Return On Sales (ROS) or "Profitability" Profit/Sales Asset Turnover or "Turnover" = Sales/Assets Return On Assets (ROA) Profitability* Turnover O Leverage = Assets/Equity Return on Equity (ROE) = Profit/Equity Free Cash Flow Cash Flow From Ops - Capital Expenditures O Working Capital Current Assets - Current Liabilities O Days of Working Capital Working Capital Projected Stock Price Market Capitialization ($M) Stock Price Shares Outstanding Book Value Per Share Equity/Shares Outstanding Price Earnings Ratio (PE)-Stock Price /EPS Market/Book Ratio = Stock Price / Book Value per Share Dividend Yield = Dividend Per Share / Stock Price Dividend Payout Ratio = Dividend Per Share / EPS 26.7% 0.9 25.496 28.1% 42,884 63,037 67 $261.18 $ 748 $114.30 8.1 2.3 0.0% 0.0%


