Need MATLAB code, not a written solution

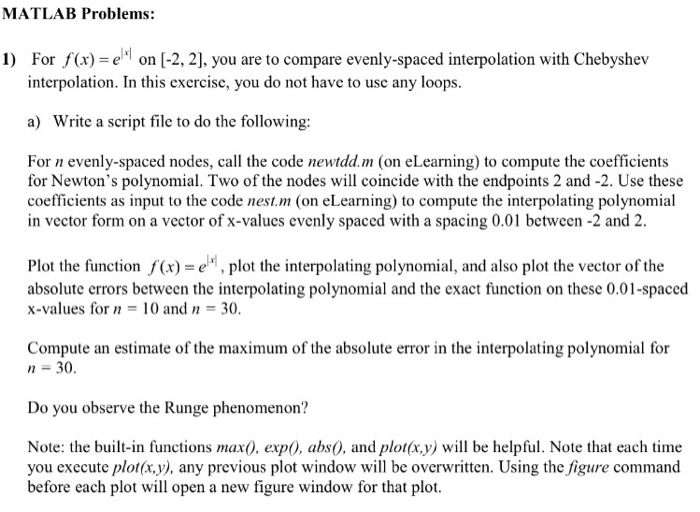
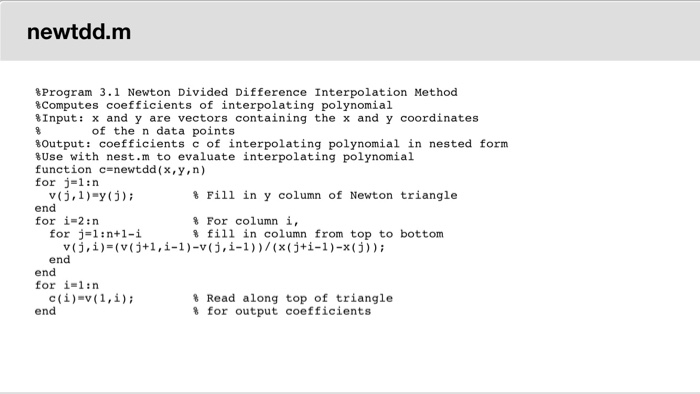
MATLAB Problems: I) For f(x) -e on [-2, 2], you are to compare evenly-spaced interpolation with Chebyshev interpolation. In this exercise, you do not have to use any loops. a) Write a script file to do the following: For n evenly-spaced nodes, call the code newtdd.m (on eLearning) to compute the coefficients for Newton's polynomial. Two of the nodes will coincide with the endpoints 2 and -2. Use these coefficients as input to the code nest.m (on eLearning) to compute the interpolating polynomial in vector form on a vector of x-values evenly spaced with a spacing 0.01 between -2 and 2 Plot the function f(x)-el , plot the interpolating polynomial, and also plot the vector of the absolute errors between the interpolating polynomial and the exact function on these 0.01-spaced x-values for n = 10 and n = 30. Compute an estimate of the maximum of the absolute error in the interpolating polynomial for n 30 Do you observe the Runge phenomenon? Note: the built-in functions max0, exp), abs0, and plot(xy) will be helpful. Note that each time you execute plot(x.y), any previous plot window will be overwritten. Using the figure command before each plot will open a new figure window for that plot. MATLAB Problems: I) For f(x) -e on [-2, 2], you are to compare evenly-spaced interpolation with Chebyshev interpolation. In this exercise, you do not have to use any loops. a) Write a script file to do the following: For n evenly-spaced nodes, call the code newtdd.m (on eLearning) to compute the coefficients for Newton's polynomial. Two of the nodes will coincide with the endpoints 2 and -2. Use these coefficients as input to the code nest.m (on eLearning) to compute the interpolating polynomial in vector form on a vector of x-values evenly spaced with a spacing 0.01 between -2 and 2 Plot the function f(x)-el , plot the interpolating polynomial, and also plot the vector of the absolute errors between the interpolating polynomial and the exact function on these 0.01-spaced x-values for n = 10 and n = 30. Compute an estimate of the maximum of the absolute error in the interpolating polynomial for n 30 Do you observe the Runge phenomenon? Note: the built-in functions max0, exp), abs0, and plot(xy) will be helpful. Note that each time you execute plot(x.y), any previous plot window will be overwritten. Using the figure command before each plot will open a new figure window for that plot


