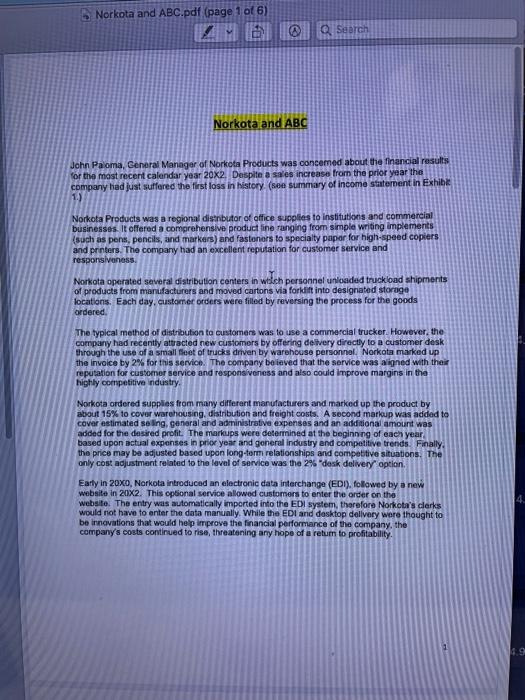
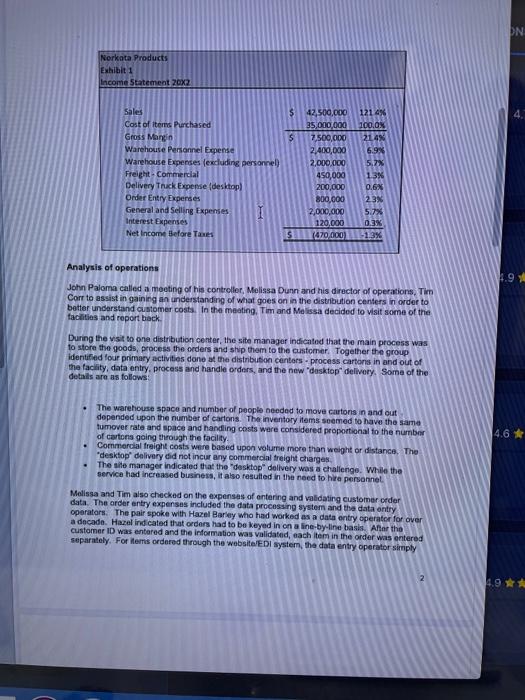
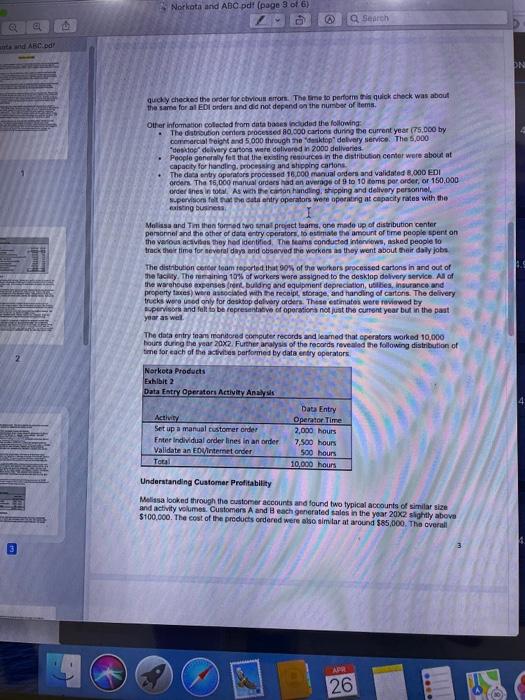
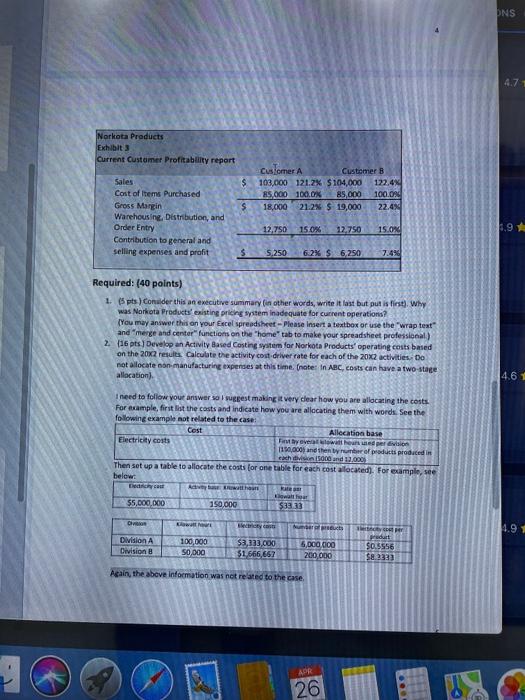
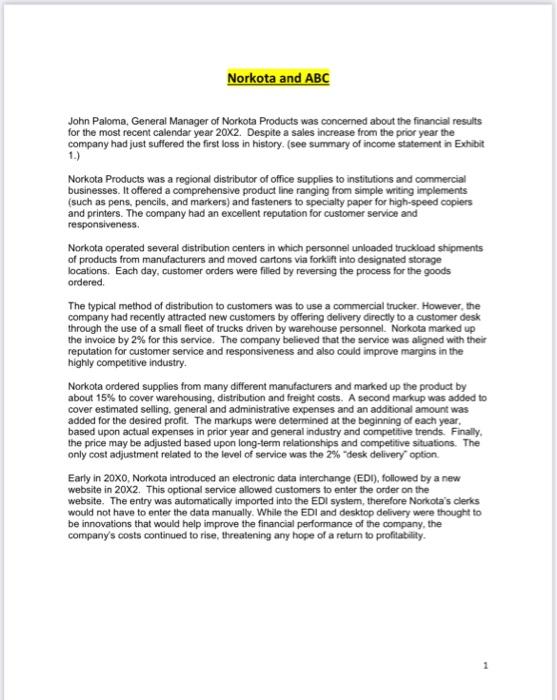
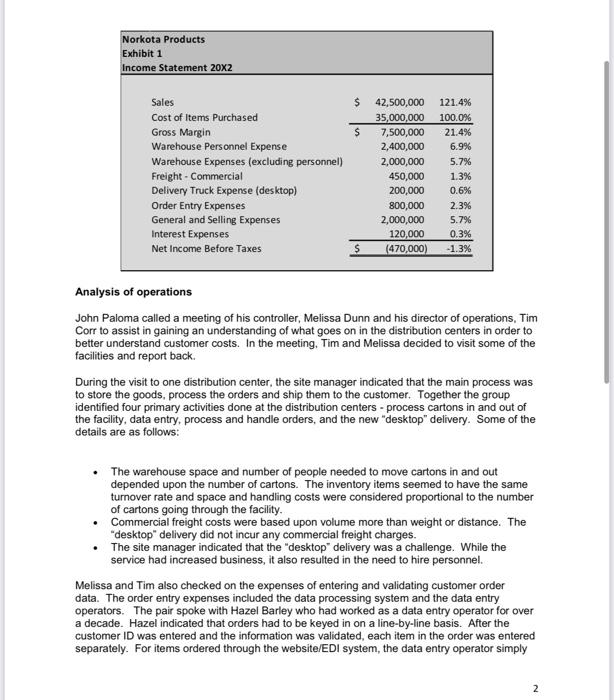
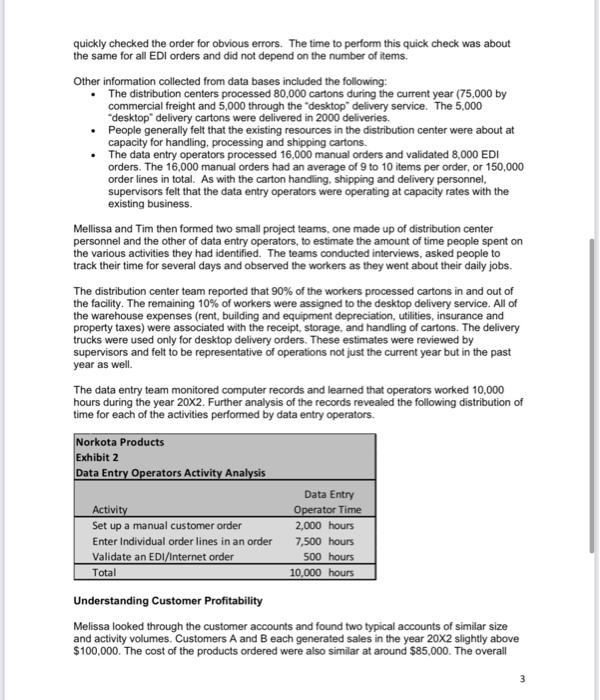
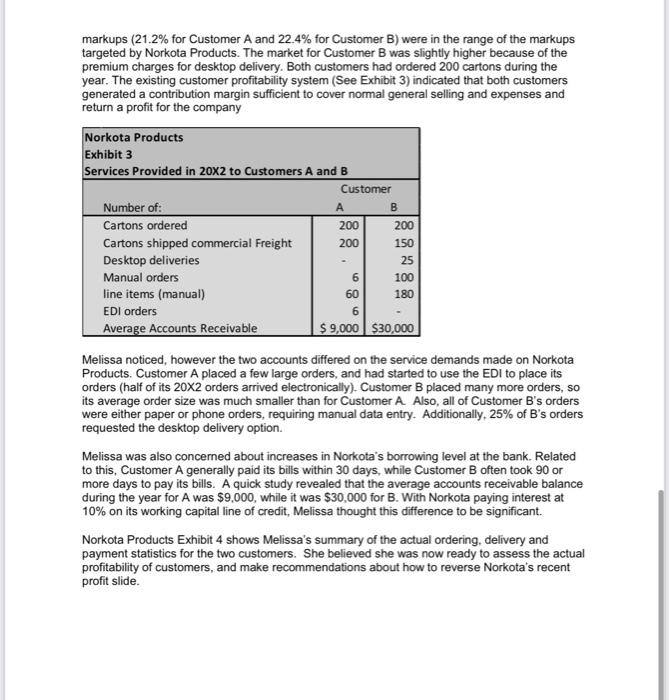
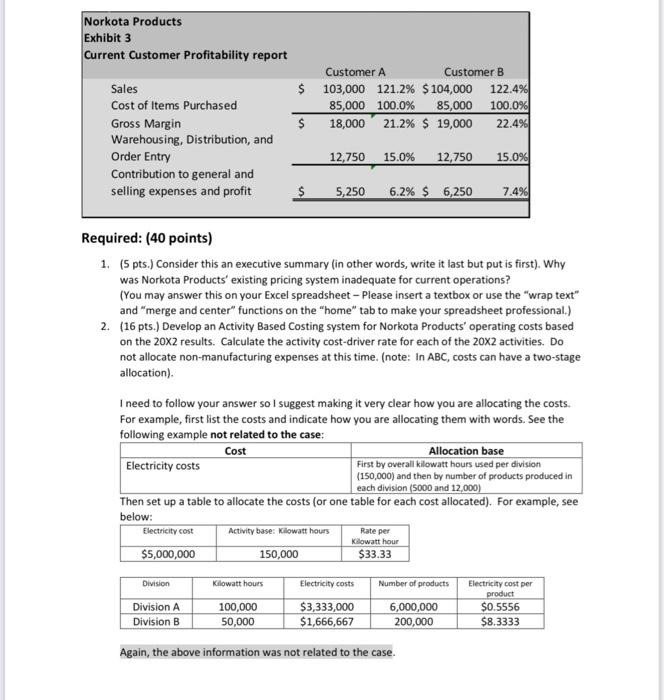
Norkota and ABC.pdf (page 1 of 6) Search Norkota and ABC John Paloma, General Manager of Norkota Products was concemed about the financial results for the most recent calendar year 20X2. Despite a sales increase from the prior year the company had just suffered the first loss in history (see summary of income statement in Exhib 1.) Norkota Products was a regional disebutor of office supplies to institutions and commercial businesses. It offered a comprehensive product line ranging from simple writing implements (such as pena, pencils, and markers) and fastoners to specialty papar for high-speed copiers and printers. The company had an excellent reputation for customer service and responsiveness Norkota operated several distribution centers in welch personnel unloaded truckload shipments of products from manufacturers and moved cartons via forklift into designated storage locations. Each day, customer orders were filled by reversing the process for the goods ordered The typical method of distribution to customers was to use a commercial trucker. However, the company had recently attracted new customers by offering delivery directly to a customer desk through the use of a small fleet of trucks driven by warehouse personnel. Norkota marked up the invoice by 2% for this service. The company be ieved that the service was aligned with the reputation for customer service and responsiveness and also could improve margins in the highly competitive industry. Norkota ordered supplies from many different manufacturers and marked up the product by about 15% to cover warehousing, distribution and freight costs. A second markup was added to cover estimated seling, general and administrative expenses and an additional amount was added for the desired profit. The markups were determined at the beginnng of each year based upon actual expenses in prior year and general industry and competitive trends. Finally, the price may be adjusted based upon long-term relationships and competitive situations. The only cost adjustment related to the level of service was the 2%"desk delivery option Early in 20xo, Norkota introduced an electronic data interchange (EDI), followed by a new website in 20x2. This optional service allowed customers to enter the order on the website. The entry was automatically imported into the EDI system, therefore Norkota's clerks would not have to enter the data manually. While the EDI and desktop dellvery were thought to be innovations that would help improve the financial performance of the company, the company's costs continued to rise, threatening any hope of a retum to profitability 4.9 ON Norkata Products Exhibit 1 Income Statement 20X2 $ 5 Sales Cost of items Purchased Gross Mann Warehouse Personnel Egense Warehouse Expenses (excluding personnel) Freight Commercial Delivery Track Expense (desktop Order Entry Expenses General and Selling Expenses Interest Expenses Net Income Before Tas 42,500,000 35,000,000 7,500,000 2,400,000 2,000,000 450,000 200,000 800,000 2,000,000 120.000 (470.000 1214% 100.0% 214% 6.9% 5.2% 13% 0.6% 23% 57% 0.3% -1.3% S 1.9 Analysis of operations John Paloma called a meeting of his controller, Melissa Dunn and his director of operations, Tim Corr to assist in gaining an understanding of what goes on in the distribution centers in order to better understand customer costs. In the meeting, Tim and Melissa decided to visit some of the facilities and report back During the visit to one distribution center, the site manager indicated that the main process was to store the goods, process the orders and ship them to the customer. Together the group identified four primary activities done at the distrbution centers-process cartons in and out of the facility, data entry process and handle orders, and the new "desktop" delivery. Some of the details are as follows 4.6 The warehouse space and number of people needed to move cantons in and out depended upon the number of cartons The inventory items seemed to have the same tumover rate and space and handling costs were considered proportional to the number of cartons going through the facility Commercial freight costs were based upon volume more than weight or distance. The "desktop" delivery did not incur any commercial freight charges The site manager indicated that the desktop delivery was a challenge. While the service had increased business, it also resulted in the need to hire personnel Melissa and Tim also checked on the expenses of entering and validating customer order data. The order entry expenses included the data processing system and the data entry operators. The pair spoke with Hazel Barley who had worked as a data entry operator for over a decade. Hazel indicated that orders had to be keyed in on a line-by-line basis. After the customer ID was entered and the information was validated, each item in the order was entered separately. For terms ordered through the website/EDI system, the data entry operator simply 2. 4.9 Narkota and ABC.pdf (page 3 of 6) edapreh and ABC od! PN quchy checked the order for obvious To The time to perform this quick check was about the same for at EDI orders and did not depend on the number of items. Other information collected from databases induded the following: . The strution centers processed 10.000 cartons during the current year (75,000 by Commercial right and 5 000 through the desktop delivery service. The 5,000 costo del very cartons were delivered in 2000 deliveries People generally felt that the existing resources in the distribution center were about at capacity for handling processing and shipping cartons The dura ry operators processed 16,000 manual orders and validated 8.000 EDI orders. The 15,000 manual orders had an average of 9 to 10 toms per order, or 150,000 ordernes in total. As with the carton handling, shipping and delivery personnel -pervision for det entry operators were operating at capacity rates with the casting business Melissa and Tim then formed two al project teatre, one made up of distribution center personnel and the other of data entry operators, to estimate the amount of time people spent on the various acavities they had identified The Moms conducted interviews, asked people to track their time for several days and observed the workers as they went about their daily jobs The distribution center team reported that 90% of the workers processed carsons in and out of the city. The remaining 10% of workers were assigned to the desktop delivery service. All of the warehouse expenses front, building and equipment depreciation, utilities. Insurance and property taxes) were associated with the receipt storage and handling of cartons. The delivery trucks were used only for desktop delivery orders. These estimates were reviewed by pervisors and fell to be representative of operations not just the current year but in the past year as well The data entry foam monitored computer records and learned that operators worked 10,000 hours during the year 20X2. Further analysis of the records revealed the following distribution of time for each of the activities performed by data entry operators Narkota Products Exhibit 2 Data Entry Operators Activity Analysis Activity Set up a manual customer order Enter Individual order lines in an order Validate an Evinternet onder Total Data Entry Operator Time 2,000 hours 7,500 hours 500 hours 10,000 hours Understanding Customer Profitability Melissa looked through the customer accounts and found two typical accounts of similar size and activity volumes Customers A and Beach generated sales in the year 20x2 slightly above $100,000. The cost of the products ordered were also similar at around $85,000. The overall APA 26 DNS Narkota Products Exhibit 3 Current Customer Profitability report $ Customer A Customer 103.000 121.2% $104,000 122.4 85.000 100.0% 85,000 100.0 18,000 21.23 $ 19,000 22.4 $ Sales Cost of items Purchased Gross Margin Warehousing, Distribution, and Order Entry Contribution to general and selling expenses and profit 12.750 15.0% 12.750 15.0% $ 5.250 62% $ 6.250 Required: (40 points) 1. pts) Consider this an executive summary in other words, write it last but put is first). Why was Norkota Products existing pricing item inadequate for current operations? [You may answer this on your Excel spreadsheet - Please insert a textbox or use the "wrap test and merge and center" functions on the "home" tab to make your spreadsheet professional) 2. 16pts Develop an Activity Based Costing system for Norota Products' operating costs based on the 202 results. Calculate the activity cost driver rate for each of the 20x2 activities. Do not allocate non manufacturing expenses at this time (note: In ABC, costs can have a two-stage allocation) 4.61 Cost I need to follow your answer so I suggest making it very clear how you are allocating the costs For example, first list the casts and indicate how you are allocating them with words. See the following example not related to the case Allocation base Electricity costs Five when we per din 11.50,000 and then we al products produced cache and 13.000 Then set up a table to allocate the costs for one table for each cost allocated). For example, see below cast Ah ke $5,000,000 150,000 $33.33 Di ducts 4.91 Division A Divisione 100,000 S0.000 $3,333,000 51.666,667 5,000,000 200,000 redut $0.5556 $82313 Again, the above information was not related to the case APR 26 Norkota and ABC John Paloma, General Manager of Norkota Products was concerned about the financial results for the most recent calendar year 20x2. Despite a sales increase from the prior year the company had just suffered the first loss in history (see summary of income statement in Exhibit 1.) Norkota Products was a regional distributor of office supplies to institutions and commercial businesses. It offered a comprehensive product line ranging from simple writing implements (such as pens, pencils, and markers) and fasteners to specialty paper for high-speed copiers and printers. The company had an excellent reputation for customer service and responsiveness Norkota operated several distribution centers in which personnel unloaded truckload shipments of products from manufacturers and moved cartons via forklift into designated storage locations. Each day, customer orders were filled by reversing the process for the goods ordered The typical method of distribution to customers was to use a commercial trucker. However, the company had recently attracted new customers by offering delivery directly to a customer desk through the use of a small fleet of trucks driven by warehouse personnel. Norkota marked up the invoice by 2% for this service. The company believed that the service was aligned with their reputation for customer service and responsiveness and also could improve margins in the highly competitive industry Norkota ordered supplies from many different manufacturers and marked up the product by about 15% to cover warehousing, distribution and freight costs. A second markup was added to cover estimated selling general and administrative expenses and an additional amount was added for the desired profit. The markups were determined at the beginning of each year, based upon actual expenses in prior year and general industry and competitive trends. Finally, the price may be adjusted based upon long-term relationships and competitive situations. The only cost adjustment related to the level of service was the 2% desk delivery option Early in 20X0, Norkota introduced an electronic data interchange (EDI), followed by a new website in 20x2. This optional service allowed customers to enter the order on the website. The entry was automatically imported into the EDI system, therefore Norkota's clerks would not have to enter the data manually. While the EDI and desktop delivery were thought to be innovations that would help improve the financial performance of the company, the company's costs continued to rise, threatening any hope of a return to profitability. 1 Norkota Products Exhibit 1 Income Statement 20X2 $ Sales Cost of Items Purchased Gross Margin Warehouse Personnel Expense Warehouse Expenses (excluding personnel) Freight - Commercial Delivery Truck Expense (desktop) Order Entry Expenses General and Selling Expenses Interest Expenses Net Income Before Taxes 42,500,000 35,000,000 7,500,000 2,400,000 2,000,000 450,000 200,000 800,000 2,000,000 120,000 (470,000) 121.4% 100.0% 21.4% 6.9% 5.7% 1.3% 0.6% 2.3% 5.7% 0.3% -1.3% Analysis of operations John Paloma called a meeting of his controller, Melissa Dunn and his director of operations, Tim Corr to assist in gaining an understanding of what goes on in the distribution centers in order to better understand customer costs. In the meeting, Tim and Melissa decided to visit some of the facilities and report back. During the visit to one distribution center, the site manager indicated that the main process was to store the goods, process the orders and ship them to the customer. Together the group identified four primary activities done at the distribution centers - process cartons in and out of the facility, data entry process and handle orders, and the new "desktop" delivery. Some of the details are as follows: The warehouse space and number of people needed to move cartons in and out depended upon the number of cartons. The inventory items seemed to have the same turnover rate and space and handling costs were considered proportional to the number of cartons going through the facility. Commercial freight costs were based upon volume more than weight or distance. The "desktop" delivery did not incur any commercial freight charges. The site manager indicated that the "desktop" delivery was a challenge. While the service had increased business, it also resulted in the need to hire personnel. Melissa and Tim also checked on the expenses of entering and validating customer order data. The order entry expenses included the data processing system and the data entry operators. The pair spoke with Hazel Barley who had worked as a data entry operator for over a decade. Hazel indicated that orders had to be keyed in on a line-by-line basis. After the customer ID was entered and the information was validated, each item in the order was entered separately. For items ordered through the website/EDI system, the data entry operator simply 2 quickly checked the order for obvious errors. The time to perform this quick check was about the same for all EDI orders and did not depend on the number of items. Other information collected from data bases included the following: The distribution centers processed 80,000 cartons during the current year (75,000 by commercial freight and 5,000 through the desktop delivery service. The 5,000 "desktop" delivery cartons were delivered in 2000 deliveries. People generally felt that the existing resources in the distribution center were about at capacity for handling processing and shipping cartons. The data entry operators processed 16,000 manual orders and validated 8,000 EDI orders. The 16,000 manual orders had an average of 9 to 10 items per order, or 150,000 order lines in total . As with the carton handling, shipping and delivery personnel, supervisors felt that the data entry operators were operating at capacity rates with the existing business. Mellissa and Tim then formed two small project teams, one made up of distribution center personnel and the other of data entry operators, to estimate the amount of time people spent on the various activities they had identified. The teams conducted interviews, asked people to track their time for several days and observed the workers as they went about their daily jobs. The distribution center team reported that 90% of the workers processed cartons in and out of the facility. The remaining 10% of workers were assigned to the desktop delivery service. All of the warehouse expenses (rent, building and equipment depreciation, utilities, insurance and property taxes) were associated with the receipt, storage, and handling of cartons. The delivery trucks were used only for desktop delivery orders. These estimates were reviewed by supervisors and felt to be representative of operations not just the current year but in the past year as well. The data entry team monitored computer records and learned that operators worked 10,000 hours during the year 20x2. Further analysis of the records revealed the following distribution of time for each of the activities performed by data entry operators. Norkota Products Exhibit 2 Data Entry Operators Activity Analysis Data Entry Activity Operator Time Set up a manual customer order 2,000 hours Enter Individual order lines in an order 7,500 hours Validate an EDI/Internet order 500 hours Total 10,000 hours Understanding Customer Profitability Melissa looked through the customer accounts and found two typical accounts of similar size and activity volumes. Customers A and B each generated sales in the year 20X2 slightly above $100,000. The cost of the products ordered were also similar at around $85,000. The overall 3 6 60 markups (21.2% for Customer A and 22.4% for Customer B) were in the range of the markups targeted by Norkota Products. The market for Customer B was slightly higher because of the premium charges for desktop delivery. Both customers had ordered 200 cartons during the year. The existing customer profitability system (See Exhibit 3) indicated that both customers generated a contribution margin sufficient to cover normal general selling and expenses and return a profit for the company Norkota Products Exhibit 3 Services Provided in 20x2 to Customers A and B Customer Number of: B Cartons ordered 200 200 Cartons shipped commercial Freight 200 150 Desktop deliveries 25 Manual orders 100 line items (manual) 180 EDI orders 6 Average Accounts Receivable $ 9,000 $30,000 Melissa noticed, however the two accounts differed on the service demands made on Norkota Products. Customer A placed a few large orders, and had started to use the EDI to place its orders (half of its 20x2 orders arrived electronically). Customer B placed many more orders, so its average order size was much smaller than for Customer A Also, all of Customer B's orders were either paper or phone orders, requiring manual data entry. Additionally, 25% of B's orders requested the desktop delivery option Melissa was also concerned about increases in Norkota's borrowing level at the bank. Related to this, Customer A generally paid its bills within 30 days, while Customer B often took 90 or more days to pay its bills. A quick study revealed that the average accounts receivable balance during the year for A was $9.000, while it was $30,000 for B. With Norkota paying interest at 10% on its working capital line of credit, Melissa thought this difference to be significant. Norkota Products Exhibit 4 shows Melissa's summary of the actual ordering, delivery and payment statistics for the two customers. She believed she was now ready to assess the actual profitability of customers, and make recommendations about how to reverse Norkota's recent profit slide. Norkota Products Exhibit 3 Current Customer Profitability report Customer A Customer B $ 103,000 121.2% $ 104,000 122.4% 85,000 100.0% 85,000 100.0% $ 18,000 21.2% $ 19,000 22.4% Sales Cost of items Purchased Gross Margin Warehousing, Distribution, and Order Entry Contribution to general and selling expenses and profit 12,750 15.0% 12,750 15.096 $ 5,250 6.2% $ 6,250 7.496 Required: (40 points) 1. (5 pts.) Consider this an executive summary (in other words, write it last but put is first). Why was Norkota Products' existing pricing system inadequate for current operations? (You may answer this on your Excel spreadsheet - Please insert a textbox or use the "wrap text" and "merge and center" functions on the "home" tab to make your spreadsheet professional) 2. (16 pts.) Develop an Activity Based Costing system for Norkota Products' operating costs based on the 20x2 results. Calculate the activity cost-driver rate for each of the 20x2 activities. Do not allocate non-manufacturing expenses at this time. (note: In ABC, costs can have a two-stage allocation) I need to follow your answer so I suggest making it very clear how you are allocating the costs. For example, first list the costs and indicate how you are allocating them with words. See the following example not related to the case: Cost Allocation base Electricity costs First by overall kilowatt hours used per division (150,000) and then by number of products produced in each division (5000 and 12,000) Then set up a table to allocate the costs (or one table for each cost allocated). For example, see below: Electricity cost Activity base: Kilowatt hours Kilowatt hour $5,000,000 150,000 $33.33 Rate per Kilowatt hours Division Division A Division B 100,000 50,000 Electricity costs $3,333,000 $1,666,667 Number of products 6,000,000 200,000 Electricity cost per product $0.5556 $8.3333 Again, the above information was not related to the case. Norkota and ABC.pdf (page 1 of 6) Search Norkota and ABC John Paloma, General Manager of Norkota Products was concemed about the financial results for the most recent calendar year 20X2. Despite a sales increase from the prior year the company had just suffered the first loss in history (see summary of income statement in Exhib 1.) Norkota Products was a regional disebutor of office supplies to institutions and commercial businesses. It offered a comprehensive product line ranging from simple writing implements (such as pena, pencils, and markers) and fastoners to specialty papar for high-speed copiers and printers. The company had an excellent reputation for customer service and responsiveness Norkota operated several distribution centers in welch personnel unloaded truckload shipments of products from manufacturers and moved cartons via forklift into designated storage locations. Each day, customer orders were filled by reversing the process for the goods ordered The typical method of distribution to customers was to use a commercial trucker. However, the company had recently attracted new customers by offering delivery directly to a customer desk through the use of a small fleet of trucks driven by warehouse personnel. Norkota marked up the invoice by 2% for this service. The company be ieved that the service was aligned with the reputation for customer service and responsiveness and also could improve margins in the highly competitive industry. Norkota ordered supplies from many different manufacturers and marked up the product by about 15% to cover warehousing, distribution and freight costs. A second markup was added to cover estimated seling, general and administrative expenses and an additional amount was added for the desired profit. The markups were determined at the beginnng of each year based upon actual expenses in prior year and general industry and competitive trends. Finally, the price may be adjusted based upon long-term relationships and competitive situations. The only cost adjustment related to the level of service was the 2%"desk delivery option Early in 20xo, Norkota introduced an electronic data interchange (EDI), followed by a new website in 20x2. This optional service allowed customers to enter the order on the website. The entry was automatically imported into the EDI system, therefore Norkota's clerks would not have to enter the data manually. While the EDI and desktop dellvery were thought to be innovations that would help improve the financial performance of the company, the company's costs continued to rise, threatening any hope of a retum to profitability 4.9 ON Norkata Products Exhibit 1 Income Statement 20X2 $ 5 Sales Cost of items Purchased Gross Mann Warehouse Personnel Egense Warehouse Expenses (excluding personnel) Freight Commercial Delivery Track Expense (desktop Order Entry Expenses General and Selling Expenses Interest Expenses Net Income Before Tas 42,500,000 35,000,000 7,500,000 2,400,000 2,000,000 450,000 200,000 800,000 2,000,000 120.000 (470.000 1214% 100.0% 214% 6.9% 5.2% 13% 0.6% 23% 57% 0.3% -1.3% S 1.9 Analysis of operations John Paloma called a meeting of his controller, Melissa Dunn and his director of operations, Tim Corr to assist in gaining an understanding of what goes on in the distribution centers in order to better understand customer costs. In the meeting, Tim and Melissa decided to visit some of the facilities and report back During the visit to one distribution center, the site manager indicated that the main process was to store the goods, process the orders and ship them to the customer. Together the group identified four primary activities done at the distrbution centers-process cartons in and out of the facility, data entry process and handle orders, and the new "desktop" delivery. Some of the details are as follows 4.6 The warehouse space and number of people needed to move cantons in and out depended upon the number of cartons The inventory items seemed to have the same tumover rate and space and handling costs were considered proportional to the number of cartons going through the facility Commercial freight costs were based upon volume more than weight or distance. The "desktop" delivery did not incur any commercial freight charges The site manager indicated that the desktop delivery was a challenge. While the service had increased business, it also resulted in the need to hire personnel Melissa and Tim also checked on the expenses of entering and validating customer order data. The order entry expenses included the data processing system and the data entry operators. The pair spoke with Hazel Barley who had worked as a data entry operator for over a decade. Hazel indicated that orders had to be keyed in on a line-by-line basis. After the customer ID was entered and the information was validated, each item in the order was entered separately. For terms ordered through the website/EDI system, the data entry operator simply 2. 4.9 Narkota and ABC.pdf (page 3 of 6) edapreh and ABC od! PN quchy checked the order for obvious To The time to perform this quick check was about the same for at EDI orders and did not depend on the number of items. Other information collected from databases induded the following: . The strution centers processed 10.000 cartons during the current year (75,000 by Commercial right and 5 000 through the desktop delivery service. The 5,000 costo del very cartons were delivered in 2000 deliveries People generally felt that the existing resources in the distribution center were about at capacity for handling processing and shipping cartons The dura ry operators processed 16,000 manual orders and validated 8.000 EDI orders. The 15,000 manual orders had an average of 9 to 10 toms per order, or 150,000 ordernes in total. As with the carton handling, shipping and delivery personnel -pervision for det entry operators were operating at capacity rates with the casting business Melissa and Tim then formed two al project teatre, one made up of distribution center personnel and the other of data entry operators, to estimate the amount of time people spent on the various acavities they had identified The Moms conducted interviews, asked people to track their time for several days and observed the workers as they went about their daily jobs The distribution center team reported that 90% of the workers processed carsons in and out of the city. The remaining 10% of workers were assigned to the desktop delivery service. All of the warehouse expenses front, building and equipment depreciation, utilities. Insurance and property taxes) were associated with the receipt storage and handling of cartons. The delivery trucks were used only for desktop delivery orders. These estimates were reviewed by pervisors and fell to be representative of operations not just the current year but in the past year as well The data entry foam monitored computer records and learned that operators worked 10,000 hours during the year 20X2. Further analysis of the records revealed the following distribution of time for each of the activities performed by data entry operators Narkota Products Exhibit 2 Data Entry Operators Activity Analysis Activity Set up a manual customer order Enter Individual order lines in an order Validate an Evinternet onder Total Data Entry Operator Time 2,000 hours 7,500 hours 500 hours 10,000 hours Understanding Customer Profitability Melissa looked through the customer accounts and found two typical accounts of similar size and activity volumes Customers A and Beach generated sales in the year 20x2 slightly above $100,000. The cost of the products ordered were also similar at around $85,000. The overall APA 26 DNS Narkota Products Exhibit 3 Current Customer Profitability report $ Customer A Customer 103.000 121.2% $104,000 122.4 85.000 100.0% 85,000 100.0 18,000 21.23 $ 19,000 22.4 $ Sales Cost of items Purchased Gross Margin Warehousing, Distribution, and Order Entry Contribution to general and selling expenses and profit 12.750 15.0% 12.750 15.0% $ 5.250 62% $ 6.250 Required: (40 points) 1. pts) Consider this an executive summary in other words, write it last but put is first). Why was Norkota Products existing pricing item inadequate for current operations? [You may answer this on your Excel spreadsheet - Please insert a textbox or use the "wrap test and merge and center" functions on the "home" tab to make your spreadsheet professional) 2. 16pts Develop an Activity Based Costing system for Norota Products' operating costs based on the 202 results. Calculate the activity cost driver rate for each of the 20x2 activities. Do not allocate non manufacturing expenses at this time (note: In ABC, costs can have a two-stage allocation) 4.61 Cost I need to follow your answer so I suggest making it very clear how you are allocating the costs For example, first list the casts and indicate how you are allocating them with words. See the following example not related to the case Allocation base Electricity costs Five when we per din 11.50,000 and then we al products produced cache and 13.000 Then set up a table to allocate the costs for one table for each cost allocated). For example, see below cast Ah ke $5,000,000 150,000 $33.33 Di ducts 4.91 Division A Divisione 100,000 S0.000 $3,333,000 51.666,667 5,000,000 200,000 redut $0.5556 $82313 Again, the above information was not related to the case APR 26 Norkota and ABC John Paloma, General Manager of Norkota Products was concerned about the financial results for the most recent calendar year 20x2. Despite a sales increase from the prior year the company had just suffered the first loss in history (see summary of income statement in Exhibit 1.) Norkota Products was a regional distributor of office supplies to institutions and commercial businesses. It offered a comprehensive product line ranging from simple writing implements (such as pens, pencils, and markers) and fasteners to specialty paper for high-speed copiers and printers. The company had an excellent reputation for customer service and responsiveness Norkota operated several distribution centers in which personnel unloaded truckload shipments of products from manufacturers and moved cartons via forklift into designated storage locations. Each day, customer orders were filled by reversing the process for the goods ordered The typical method of distribution to customers was to use a commercial trucker. However, the company had recently attracted new customers by offering delivery directly to a customer desk through the use of a small fleet of trucks driven by warehouse personnel. Norkota marked up the invoice by 2% for this service. The company believed that the service was aligned with their reputation for customer service and responsiveness and also could improve margins in the highly competitive industry Norkota ordered supplies from many different manufacturers and marked up the product by about 15% to cover warehousing, distribution and freight costs. A second markup was added to cover estimated selling general and administrative expenses and an additional amount was added for the desired profit. The markups were determined at the beginning of each year, based upon actual expenses in prior year and general industry and competitive trends. Finally, the price may be adjusted based upon long-term relationships and competitive situations. The only cost adjustment related to the level of service was the 2% desk delivery option Early in 20X0, Norkota introduced an electronic data interchange (EDI), followed by a new website in 20x2. This optional service allowed customers to enter the order on the website. The entry was automatically imported into the EDI system, therefore Norkota's clerks would not have to enter the data manually. While the EDI and desktop delivery were thought to be innovations that would help improve the financial performance of the company, the company's costs continued to rise, threatening any hope of a return to profitability. 1 Norkota Products Exhibit 1 Income Statement 20X2 $ Sales Cost of Items Purchased Gross Margin Warehouse Personnel Expense Warehouse Expenses (excluding personnel) Freight - Commercial Delivery Truck Expense (desktop) Order Entry Expenses General and Selling Expenses Interest Expenses Net Income Before Taxes 42,500,000 35,000,000 7,500,000 2,400,000 2,000,000 450,000 200,000 800,000 2,000,000 120,000 (470,000) 121.4% 100.0% 21.4% 6.9% 5.7% 1.3% 0.6% 2.3% 5.7% 0.3% -1.3% Analysis of operations John Paloma called a meeting of his controller, Melissa Dunn and his director of operations, Tim Corr to assist in gaining an understanding of what goes on in the distribution centers in order to better understand customer costs. In the meeting, Tim and Melissa decided to visit some of the facilities and report back. During the visit to one distribution center, the site manager indicated that the main process was to store the goods, process the orders and ship them to the customer. Together the group identified four primary activities done at the distribution centers - process cartons in and out of the facility, data entry process and handle orders, and the new "desktop" delivery. Some of the details are as follows: The warehouse space and number of people needed to move cartons in and out depended upon the number of cartons. The inventory items seemed to have the same turnover rate and space and handling costs were considered proportional to the number of cartons going through the facility. Commercial freight costs were based upon volume more than weight or distance. The "desktop" delivery did not incur any commercial freight charges. The site manager indicated that the "desktop" delivery was a challenge. While the service had increased business, it also resulted in the need to hire personnel. Melissa and Tim also checked on the expenses of entering and validating customer order data. The order entry expenses included the data processing system and the data entry operators. The pair spoke with Hazel Barley who had worked as a data entry operator for over a decade. Hazel indicated that orders had to be keyed in on a line-by-line basis. After the customer ID was entered and the information was validated, each item in the order was entered separately. For items ordered through the website/EDI system, the data entry operator simply 2 quickly checked the order for obvious errors. The time to perform this quick check was about the same for all EDI orders and did not depend on the number of items. Other information collected from data bases included the following: The distribution centers processed 80,000 cartons during the current year (75,000 by commercial freight and 5,000 through the desktop delivery service. The 5,000 "desktop" delivery cartons were delivered in 2000 deliveries. People generally felt that the existing resources in the distribution center were about at capacity for handling processing and shipping cartons. The data entry operators processed 16,000 manual orders and validated 8,000 EDI orders. The 16,000 manual orders had an average of 9 to 10 items per order, or 150,000 order lines in total . As with the carton handling, shipping and delivery personnel, supervisors felt that the data entry operators were operating at capacity rates with the existing business. Mellissa and Tim then formed two small project teams, one made up of distribution center personnel and the other of data entry operators, to estimate the amount of time people spent on the various activities they had identified. The teams conducted interviews, asked people to track their time for several days and observed the workers as they went about their daily jobs. The distribution center team reported that 90% of the workers processed cartons in and out of the facility. The remaining 10% of workers were assigned to the desktop delivery service. All of the warehouse expenses (rent, building and equipment depreciation, utilities, insurance and property taxes) were associated with the receipt, storage, and handling of cartons. The delivery trucks were used only for desktop delivery orders. These estimates were reviewed by supervisors and felt to be representative of operations not just the current year but in the past year as well. The data entry team monitored computer records and learned that operators worked 10,000 hours during the year 20x2. Further analysis of the records revealed the following distribution of time for each of the activities performed by data entry operators. Norkota Products Exhibit 2 Data Entry Operators Activity Analysis Data Entry Activity Operator Time Set up a manual customer order 2,000 hours Enter Individual order lines in an order 7,500 hours Validate an EDI/Internet order 500 hours Total 10,000 hours Understanding Customer Profitability Melissa looked through the customer accounts and found two typical accounts of similar size and activity volumes. Customers A and B each generated sales in the year 20X2 slightly above $100,000. The cost of the products ordered were also similar at around $85,000. The overall 3 6 60 markups (21.2% for Customer A and 22.4% for Customer B) were in the range of the markups targeted by Norkota Products. The market for Customer B was slightly higher because of the premium charges for desktop delivery. Both customers had ordered 200 cartons during the year. The existing customer profitability system (See Exhibit 3) indicated that both customers generated a contribution margin sufficient to cover normal general selling and expenses and return a profit for the company Norkota Products Exhibit 3 Services Provided in 20x2 to Customers A and B Customer Number of: B Cartons ordered 200 200 Cartons shipped commercial Freight 200 150 Desktop deliveries 25 Manual orders 100 line items (manual) 180 EDI orders 6 Average Accounts Receivable $ 9,000 $30,000 Melissa noticed, however the two accounts differed on the service demands made on Norkota Products. Customer A placed a few large orders, and had started to use the EDI to place its orders (half of its 20x2 orders arrived electronically). Customer B placed many more orders, so its average order size was much smaller than for Customer A Also, all of Customer B's orders were either paper or phone orders, requiring manual data entry. Additionally, 25% of B's orders requested the desktop delivery option Melissa was also concerned about increases in Norkota's borrowing level at the bank. Related to this, Customer A generally paid its bills within 30 days, while Customer B often took 90 or more days to pay its bills. A quick study revealed that the average accounts receivable balance during the year for A was $9.000, while it was $30,000 for B. With Norkota paying interest at 10% on its working capital line of credit, Melissa thought this difference to be significant. Norkota Products Exhibit 4 shows Melissa's summary of the actual ordering, delivery and payment statistics for the two customers. She believed she was now ready to assess the actual profitability of customers, and make recommendations about how to reverse Norkota's recent profit slide. Norkota Products Exhibit 3 Current Customer Profitability report Customer A Customer B $ 103,000 121.2% $ 104,000 122.4% 85,000 100.0% 85,000 100.0% $ 18,000 21.2% $ 19,000 22.4% Sales Cost of items Purchased Gross Margin Warehousing, Distribution, and Order Entry Contribution to general and selling expenses and profit 12,750 15.0% 12,750 15.096 $ 5,250 6.2% $ 6,250 7.496 Required: (40 points) 1. (5 pts.) Consider this an executive summary (in other words, write it last but put is first). Why was Norkota Products' existing pricing system inadequate for current operations? (You may answer this on your Excel spreadsheet - Please insert a textbox or use the "wrap text" and "merge and center" functions on the "home" tab to make your spreadsheet professional) 2. (16 pts.) Develop an Activity Based Costing system for Norkota Products' operating costs based on the 20x2 results. Calculate the activity cost-driver rate for each of the 20x2 activities. Do not allocate non-manufacturing expenses at this time. (note: In ABC, costs can have a two-stage allocation) I need to follow your answer so I suggest making it very clear how you are allocating the costs. For example, first list the costs and indicate how you are allocating them with words. See the following example not related to the case: Cost Allocation base Electricity costs First by overall kilowatt hours used per division (150,000) and then by number of products produced in each division (5000 and 12,000) Then set up a table to allocate the costs (or one table for each cost allocated). For example, see below: Electricity cost Activity base: Kilowatt hours Kilowatt hour $5,000,000 150,000 $33.33 Rate per Kilowatt hours Division Division A Division B 100,000 50,000 Electricity costs $3,333,000 $1,666,667 Number of products 6,000,000 200,000 Electricity cost per product $0.5556 $8.3333 Again, the above information was not related to the case