need only 4,5,6

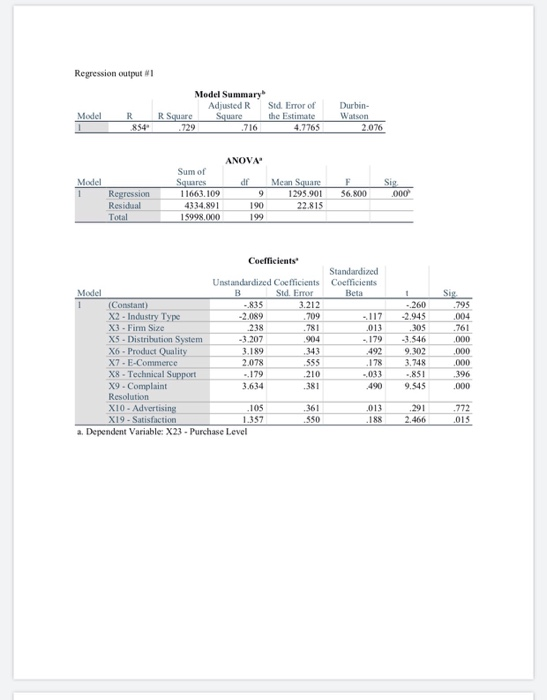
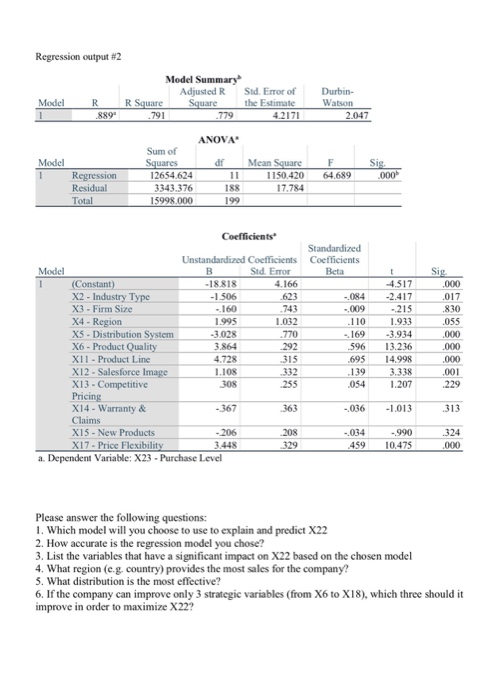
Regression output # Model Summary Std. Error of Durbin- Watson Adjusted R Square Model R R Square the Estimate 854 729 716 4,7765 2,076 ANOVA Sum of Sig. dt Model Squares 11663,109 Mean Square 1295.901 000 1 Regression 56,800 Residual 4334.89 190 22.815 15998.000 Total 199 Coefficients Standardized Unstandardized Coefficients Std. Error Coefficients Model Sig B Beta (Constant) X2-Industry Type X3 Firm Size X5 Distribution System X6- Product Quality X7- E-Commerce X8-Technical Support X9 Complaint Resolution X10- Advertising -835 3.212 .260 .795 .709 -2.089 -2.945 J17 004 238 781 013 ,305 761 -3.207 904 179 -3.546 000 9.302 3.189 343 492 000 2.078 555 178 3,748 000 210 033 .851 396 179 3.634 .381 9.545 490 000 361 013 291 772 105 X19- Satisfaction 1.357 550 188 2.466 015 a. Dependent Variable: X23- Purchase Level Regression output # 2 Model Summary Adjusted R Square Std. Error of the Estimate Durbin- Watson Model R. R Square 1 889 791 779 4.2171 2.047 ANOVA Sum of Squares 12654.624 Model df Mean Square Sig. 000 Regression Residual 11 1150.420 64.689 3343.376 188 17.784 199 Total 15998.000 Coefficients Standardized Coefficients Beta Unstandardized Coefficients Std. Eror Model B Sig. 000 (Constant) -18.818 4.166 4.517 X2 Industry Type -1.506 .623 .084 -2.417 017 X3 - Firm Size -160 743 ,009 215 830 X4-Region 1,995 1,032 110 1,933 055 X5- Distribution System X6- Product Quality -3.028 770 169 -3.934 000 3.864 292 596 13.236 000 X11 Product Line 4.728 315 695 14.998 000 X12- Salesforce Image X13- Competitive Pricing X14-Warranty & 1.108 308 332 255 139 054 3.338 1.207 001 229 -367 363 .036 -1.013 313 Claims X15- New Products -206 208 -034 990 324 X17- Price Flexibility a. Dependent Variable: X23 Purchase Level 3.448 329 459 10.475 000 Please answer the following questions: 1. Which model will you choose to use to explain and predict X22 2. How accurate is the regression model you chose? 3. List the variables that have a significant impact on X22 based on the chosen model 4. What region (e.g. country) provides the most sales for the company? 5. What distribution is the most effective? 6. If the company can improve only 3 strategic variables (from X6 to X18), which three should it improve in order to maximize X22? Regression output # Model Summary Std. Error of Durbin- Watson Adjusted R Square Model R R Square the Estimate 854 729 716 4,7765 2,076 ANOVA Sum of Sig. dt Model Squares 11663,109 Mean Square 1295.901 000 1 Regression 56,800 Residual 4334.89 190 22.815 15998.000 Total 199 Coefficients Standardized Unstandardized Coefficients Std. Error Coefficients Model Sig B Beta (Constant) X2-Industry Type X3 Firm Size X5 Distribution System X6- Product Quality X7- E-Commerce X8-Technical Support X9 Complaint Resolution X10- Advertising -835 3.212 .260 .795 .709 -2.089 -2.945 J17 004 238 781 013 ,305 761 -3.207 904 179 -3.546 000 9.302 3.189 343 492 000 2.078 555 178 3,748 000 210 033 .851 396 179 3.634 .381 9.545 490 000 361 013 291 772 105 X19- Satisfaction 1.357 550 188 2.466 015 a. Dependent Variable: X23- Purchase Level Regression output # 2 Model Summary Adjusted R Square Std. Error of the Estimate Durbin- Watson Model R. R Square 1 889 791 779 4.2171 2.047 ANOVA Sum of Squares 12654.624 Model df Mean Square Sig. 000 Regression Residual 11 1150.420 64.689 3343.376 188 17.784 199 Total 15998.000 Coefficients Standardized Coefficients Beta Unstandardized Coefficients Std. Eror Model B Sig. 000 (Constant) -18.818 4.166 4.517 X2 Industry Type -1.506 .623 .084 -2.417 017 X3 - Firm Size -160 743 ,009 215 830 X4-Region 1,995 1,032 110 1,933 055 X5- Distribution System X6- Product Quality -3.028 770 169 -3.934 000 3.864 292 596 13.236 000 X11 Product Line 4.728 315 695 14.998 000 X12- Salesforce Image X13- Competitive Pricing X14-Warranty & 1.108 308 332 255 139 054 3.338 1.207 001 229 -367 363 .036 -1.013 313 Claims X15- New Products -206 208 -034 990 324 X17- Price Flexibility a. Dependent Variable: X23 Purchase Level 3.448 329 459 10.475 000 Please answer the following questions: 1. Which model will you choose to use to explain and predict X22 2. How accurate is the regression model you chose? 3. List the variables that have a significant impact on X22 based on the chosen model 4. What region (e.g. country) provides the most sales for the company? 5. What distribution is the most effective? 6. If the company can improve only 3 strategic variables (from X6 to X18), which three should it improve in order to maximize X22


