

Question: need r&d Round 2 pls! Name Pimno Size MTBF Revision Date Age at Revision RAD Cost Baker 5.5 14.4 17.0 10 Bead Perceptual Map (at
need r&d Round 2 pls!
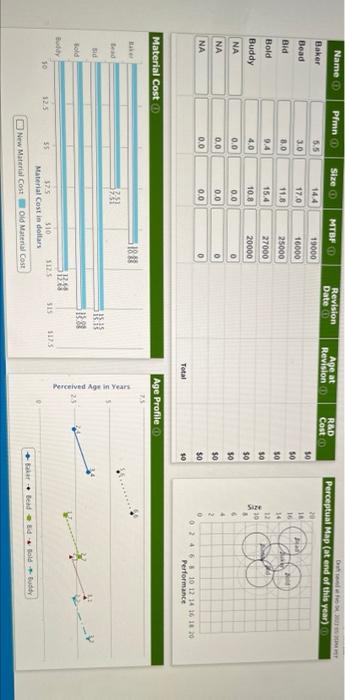
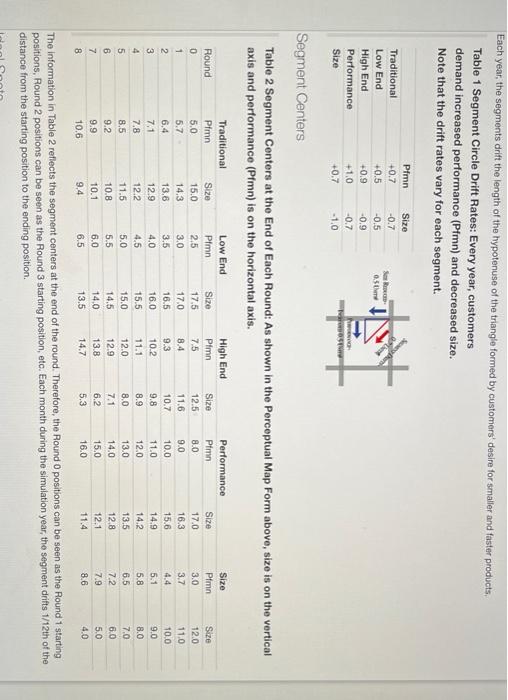
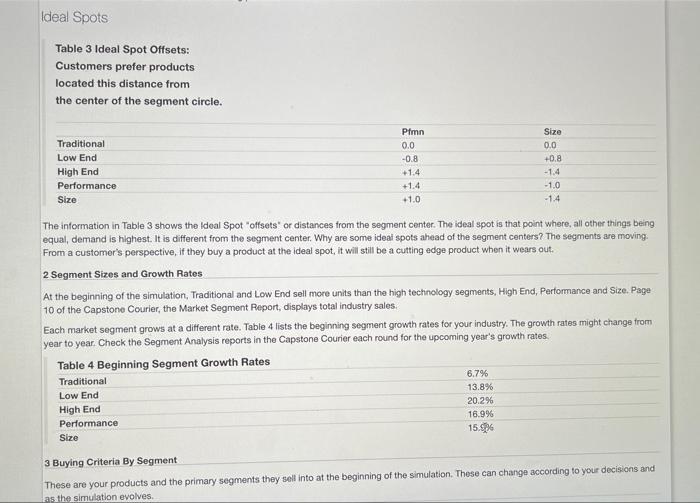
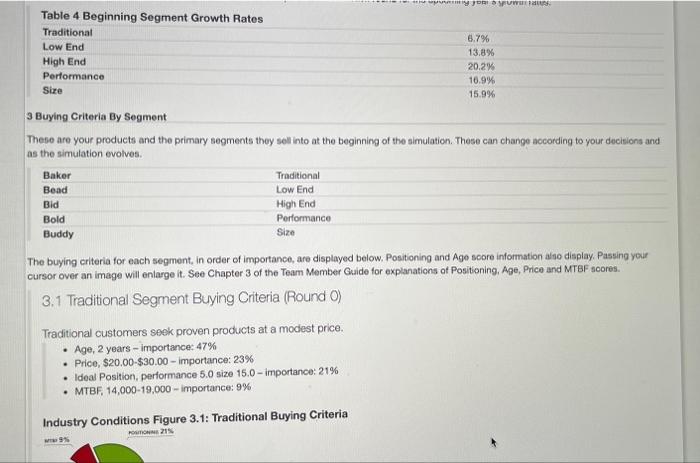
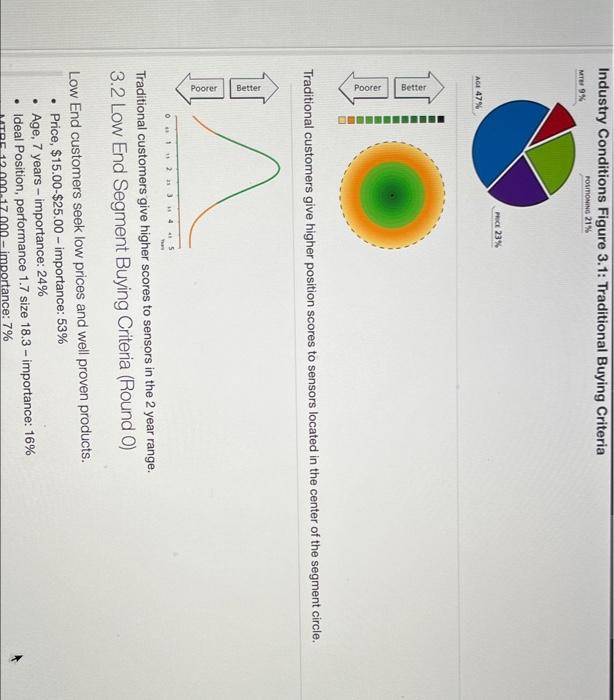
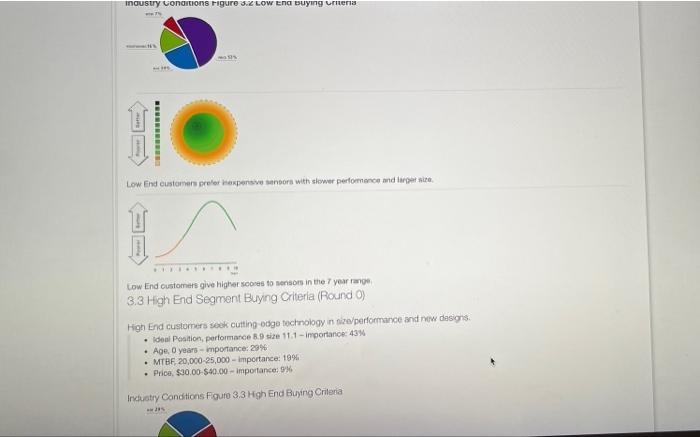
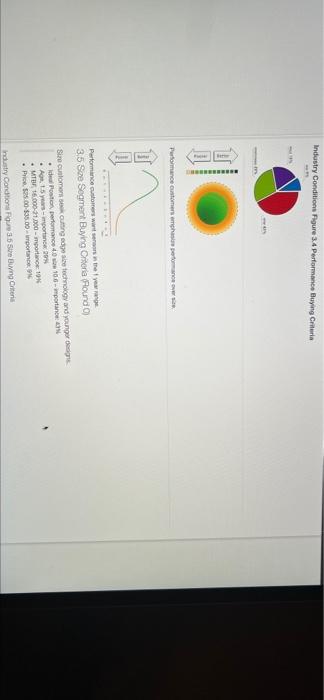
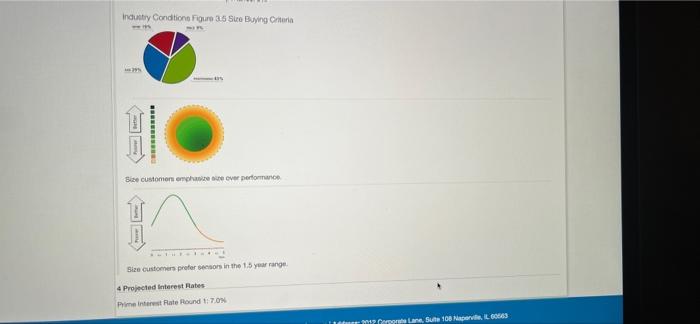
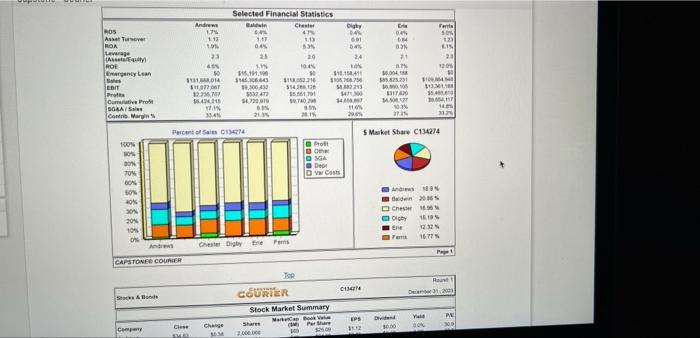
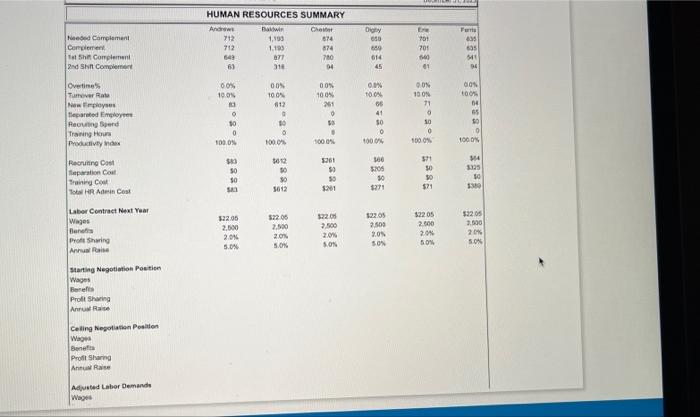
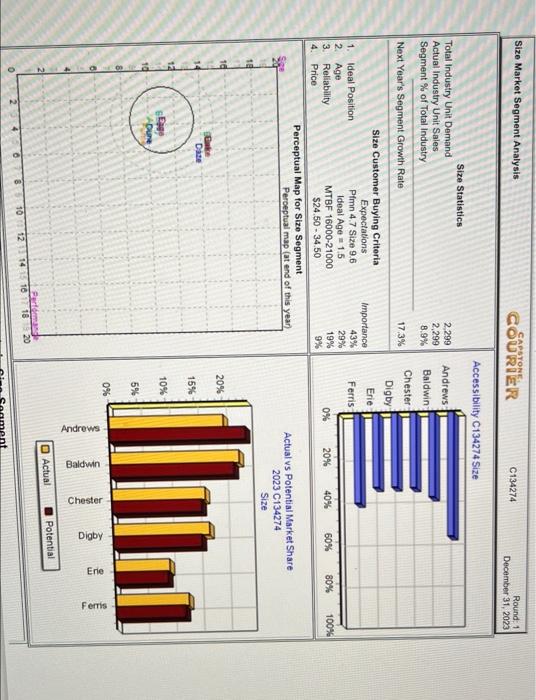
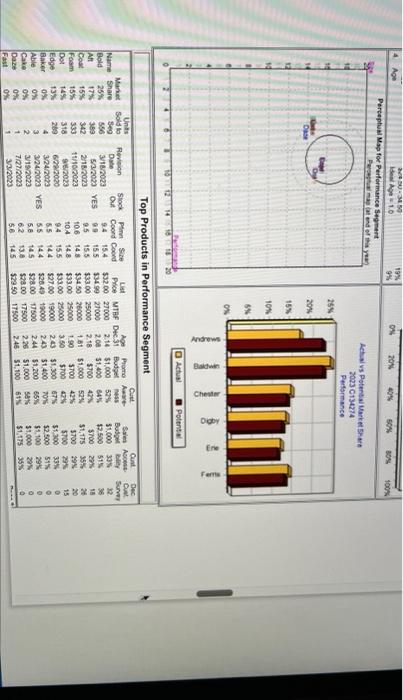
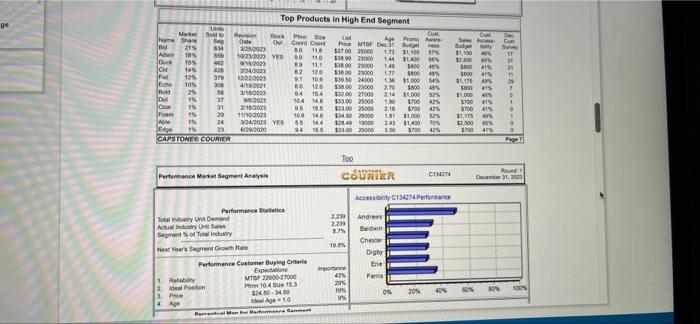
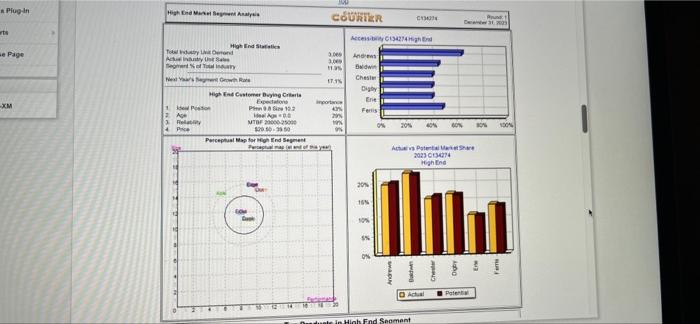
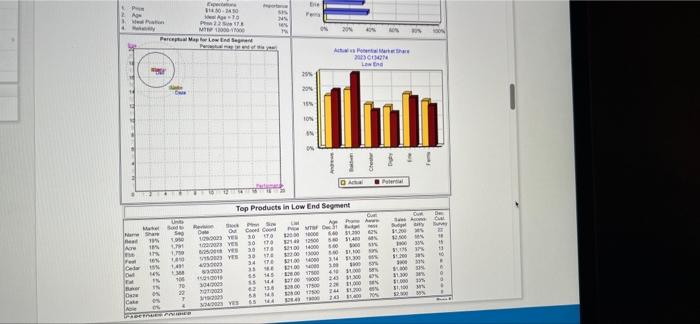
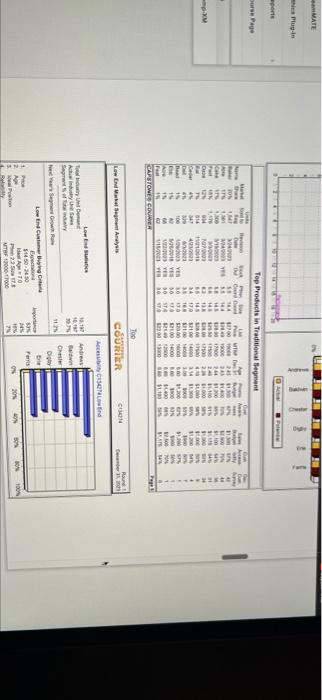
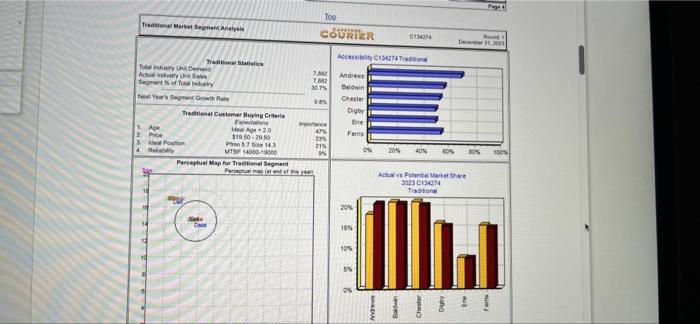
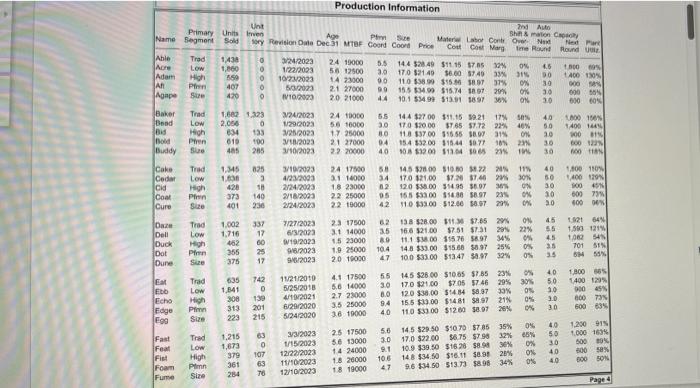
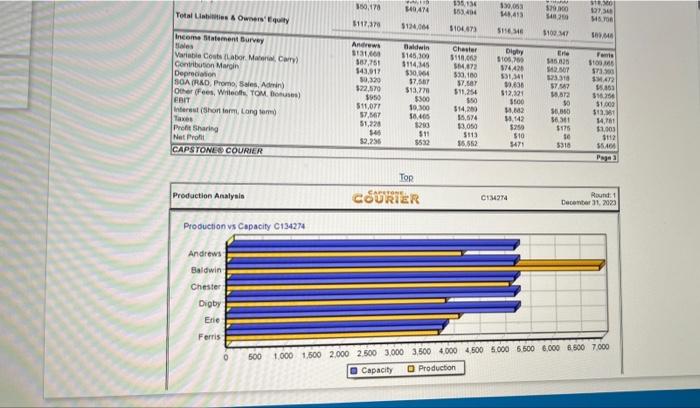
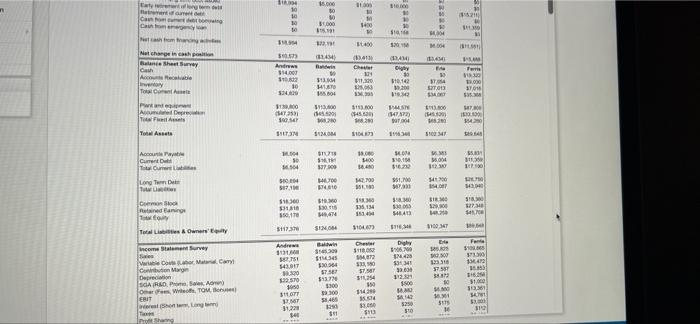
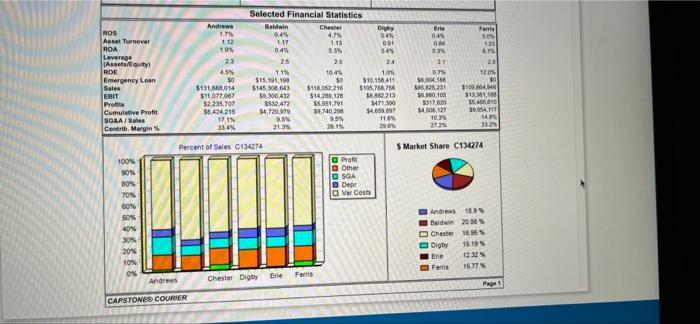
Name Pimno Size MTBF Revision Date Age at Revision RAD Cost Baker 5.5 14.4 17.0 10 Bead Perceptual Map (at end of this year) 2 18 16 14 3.0 80 50 Bid 19000 16000 25000 27000 20000 11.8 Bold 9.4 12 15.4 10.8 50 50 50 4.0 S24 Buddy NA 3 0.0 0.0 NA 50 $0 0.0 00 4 2 NA 0.0 0.0 0 $0 0246 10 12 14 16 18 20 Performance Total 50 Material Cost Age Profile 75 51833 tead 63.31 sic Perceived Age in Years Bold BY so 1125 125 SIS 588 55 375 $10 Material Cost in dollars New Material Cost Old Material Cost Bead Ed Hold-uddy Each year, the segments drift the length of the hypotenuse of the triangle formed by customers' desire for smaller and faster products. Table 1 Segment Circle Drift Rates: Every year, customers demand increased performance (Pfmn) and decreased size. Note that the drift rates vary for each segment. 0.5 Traditional Low End High End Performance Size Pimn +0.7 +0.5 +0.9 +1.0 +0.7 Size -0.7 -0.5 -0.9 -0.7 - 1.0 Segment Centers Table 2 Segment Centers at the End of Each Round: As shown in the Perceptual Map Form above, size is on the vertical axis and performance (Pfmn) is on the horizontal axis. Size Round 0 1 OOO 2 3 Traditional Pimn 5.0 5.7 6.4 7,1 7.8 8.5 9.2 9.9 10.6 CON Low End Pimn 2.5 3.0 3.5 4.0 4.5 5.0 5.5 6.0 6.5 15.0 14.3 13.6 12.9 12.2 11.5 10.8 10.1 9.4 Size 17.5 17.0 16.5 16.0 15.5 15.0 14.5 14.0 13,5 High End Pfmn 7.5 8.4 9.3 10.2 11.1 12.0 12.9 13.8 14.7 Size 12.5 11.6 10.7 9.8 8.9 8.0 Performance Pimn 8.0 9.0 10.0 11.0 12.0 13.0 14.0 15.0 16.0 Size 17.0 16.3 15.6 14.9 14.2 13.5 12.8 12.1 11.4 Size Pimn 3.0 3.7 4.4 5.1 5.8 6.5 7.2 7.9 8.6 Size 12.0 11.0 100 9.0 8.0 7.0 6.0 5.0 4.0 GO 4 5 7.1 6 7 DO o o 6.2 5.3 8 The information in Table 2 reflects the segment centers at the end of the round. Therefore, the Round 0 positions can be seen as the Round 1 starting positions, Round 2 positions can be seen as the Round 3 starting position, etc. Each month during the simulation year, the segment drifts 1/12th of the distance from the starting position to the ending position. Ideal Spots Table 3 Ideal Spot Offsets: Customers prefer products located this distance from the center of the segment circle. Traditional Low End High End Performance Size Pimn 0.0 -0.8 +1.4 +1.4 +1.0 Size 0.0 +0.8 -1.4 -1.0 -1.4 The information in Table 3 shows the Ideal Spot "offsets or distances from the segment center. The ideal spot is that point where, all other things being equal, demand is highest. It is different from the segment center. Why are some ideal spots ahead of the segment centers? The segments are moving. From a customer's perspective, if they buy a product at the ideal spot, it will still be a cutting edge product when it wears out. 2 Segment Sizes and Growth Rates At the beginning of the simulation, Traditional and Low End sell more units than the high technology segments, High End, Performance and Size. Page 10 of the Capstone Courier, the Market Segment Report, displays total industry sales. Each market segment grows at a different rate. Table 4 lists the beginning segment growth rates for your industry. The growth rates might change from year to year. Check the Segment Analysis reports in the Capstone Courier each round for the upcoming year's growth rates. Table 4 Beginning Segment Growth Rates Traditional 6.7% Low End 13.8% High End 20.2% Performance 16.9% Size 15.9% 3 Buying Criteria By Segment These are your products and the primary segments they sell into at the beginning of the simulation. These can change according to your decisions and as the simulation evolves. ROUW Table 4 Beginning Segment Growth Rates Traditional 6.79 Low End 13.8% High End 20.2% Performance 10.9% Size 15.9% 3 Buying Criteria By Segment These are your products and the primary segments they sell into at the beginning of the simulation. These can change according to your decisions and as the simulation evolves Baker Traditional Bead Low End Bid High End Bold Performance Buddy Size The buying criteria for each segment, in order of importance, are displayed below. Positioning and Age score information also display. Passing your cursor over an image will enlarge it. See Chapter 3 of the Team Member Guide for explanations of Positioning, Age, Price and MTBF scores. 3.1 Traditional Segment Buying Criteria (Round ) Traditional customers seek proven products at a modest price. Age, 2 years - Importance: 47% Price, $20.00-$30.00 - importance: 23% Ideal Position, performance 5.0 size 15.0 - importance: 21% MTBF 14,000-19,000 - importance: 9% Industry Conditions Figure 3.1: Traditional Buying Criteria ON 21% Industry Conditions Figure 3.1: Traditional Buying Criteria POLONING 21% MTE 9% PRICE 23% AGE 47% Better Poorer Traditional customers give higher position scores to sensors located in the center of the segment circle. Better n Poorer 0 1 2 3 4 5 Traditional customers give higher scores to sensors in the 2 year range. 3.2 Low End Segment Buying Criteria (Round 0) Low End customers seek low prices and well proven products. Price, $15.00-$25.00 - importance: 53% Age, 7 years - importance: 24% Ideal Position, performance 1.7 size 18.3 - importance: 16% 100 - importance: 7% . industry conditions Figure 3.2 LOW Ena suying uriens Low End customers preferensvestors with slower performance and large wire Low End customers give higher scores to sensors in the year range 3.3 High End Segment Buying Criteria (Round 0) High End customers seek cutting edge technology in ne/performance and new designs Ideal Position, performance 8.9 size 11.1 - Importance: 43% Age 0 years importance: 29% MTBF 20.000-25,000 - Importance: 1996 Price $30.00 $40.00 - importance: 9% Industry Conditions Four 33 High End Buying Critena Industry Conditions Figure 3.4 Performance Buying Criteria RE Puromance customers Performance or wintersey 3.5 Sze Segmont Buying Criteria Round) Sire customers cuing edge technology and younger Gigs Potce 106mporta Asymportance . 16.000.000 - mono 103 . Pro 25.00-$35.00 morte Industry Conditions For Bing Criteris Industry Condition Figure 3.5 Sure Buying Criteria BAND Size customen emphasize ver performance Size customers professors in the 15 year range 4 Projected Interest Rates Pienst Rate Round 7.0 Tour Lane, Sute 108 aprIL 60663 E Andrews 174 113 w 634 NO Tervis 50 123 21 20 120 ** Selected Financial Statistics Chester Digly 04 1.17 13 001 04 23 20 24 100 LON 3.11.10 140.15241 S3 372282210 SOMA 12.306292 $324 2010 10. 2015 BOS Assets ROA Laverage Aitant ROE Erreny Lan EDIT Profit Cum Probet SGLAS M 08 30.04. 33 4 5132014 SH 12. . 35.4 05 TOS BMW 3310 58 ww METE w WE w NO SELE 17 WE Percent of 134274 S Market Share C134274 son Prot OSSA De DV Costs DON 70 60 NEW 40 30 20 10 NOE 20365 Che Dohy 165 En 1675 Che Digby Fans CAPSTONE COURIER CAN 2000 Son & TOR COURTIER Stock Market Summary Share Perhe V PE Cluse Change MM Didend 3000 Need Complement Complement 1 Shi Complement 2nd SN Complement HUMAN RESOURCES SUMMARY And Dawi CM 712 1.100 574 712 1.100 874 642 ATT 780 63 316 94 Diy 650 680 014 45 E 701 701 600 Furn 835 695 141 06 dos 00% 10:08 OX 0 0 66 0.0% 100N 71 100% 00% 100% 261 0 Overtine's Tumhver Rate Now players theparated Em Routing Spord Training Hours Productivity OON 100 612 0 10 0 100 65 o 10 0 1000 . 1000 30 0 1000 SO 0 1000% 0 100DN Recruiting Cool feparation Coul training Cou To A Cost 383 50 50 SD 3012 30 SO 5012 2261 50 50 50 50 1271 50 vo 371 14 3335 10 1201 Labor Contract Next Year Wages Benes Pro Sharing Annual Raise 122.95 2.500 2.0 12200 2.500 2.0 5. 7.500 20% SON 122.05 2.500 2.05 SON 52205 2.500 2014 50% 53205 7.500 2.0% SON Starting Negotiation Position Wages Bares Profit Sharing Ar Raise Celing Negotiation Position Wages Benefits Profit Sharing AR Adjusted Labor Demande Wages Size Market Segment Analysis CAPSYONE COURIER C134274 Round: 1 December 31, 2023 Accessibility C134274 Size Andrews Size Statistics Total Industry Unit Demand Actual Industry Unit Sales Segment % of Total Industry Next Year's Segment Growth Rate 2.299 2,299 8.9% Baldwin 17.3% Chester Digby Erie Ferris Size Customer Buying Criteria Expectations Importance 1. Ideal Position Pimn 4.7 Size 9.6 43% 2 Age Ideal Age 15 29% 3. Reliability MTBF 16000-21000 19% 4. Price $24.50 - 34.50 9% Perceptual Map for Size Segment Peroeptual map (at end of this year 0% 20% 40% 60% 80% 100% Actual vs Potential Market Share 2023 C134274 Size 20% Dise 15% Ahme 10% Ege De 10 5% 0% 4 O Actual Potential Per 12 14 16 17 18 4 Age 19% MES del A10 Perceptual Map for Performance Segment 30%, 100% Achals Poteris Market Share 2023 134274 Performance 25% D 20% 15% 10N On Andrews Actual Potenta TO Top Products in Performance Segment Dec Cut Survey 2 98 20 Units Mart Sold to Name Share Seg Bold 25% AR 17% 39 Coat 15% 342 Foam 15% 333 Dot 14% 318 13 209 Raker 0% 4 Able 0% 3 Cake 0% 2 Daze 0% Fast 0% 1 3700 List Age Promo Art Price MTBF Dec.31 Budget $32.00 27000 2.14 $1.000 52% $340 27000 208 51.400 605 $3300 25000 2.18 5700 424 $3450 20000 1.81 $1.000 53 $53.00 25000 150 43 $3300 25000 3.50 $700 52700 19000 243 51.300 67 $26.4919000 24) $1.400 70 $28.00 17500 2.44 $1.200 85% 5:28 DO 17500 226 $1,000 so $29.50 17500 24 $1,100 61% Revision Stock PS Date Out Coord Coord 3/10/2022 94 154 53/2003 YES 99 155 2/18/2020 2.5 155 11/10/2023 106 143 62023 104 148 622020 94 155 3/24/2073 65 144 1242093 YES 55 144 3/192022 5.8 145 7127/2003 62 13.6 33/2023 56 145 Cust Sales Aces Budget 31.000 335 $2.500 515 5700 20% $1,175 35% 3700 5700 29 $1.300 334 5200 51% $1.100 293 31000 201 $1.17535% ON 15 Edge o 0 ge Du Sarney IT 31 29 Mar 50 Name 215 64 Aca 568 Du 155 IC 14 28 125 37 Ech 105 06 Bold 2 56 15 37 Coa 31 Foan 29 24 Ede 11 CAPSTONES COURIER Top Products in High End Segment ON O Out Ae Coordon Pre Pro MF Desi 2203 80 118 53700 25000 1.71 31,900 10/22022 YES 110 S300 21000 1.44 1.400 es 2923 39 112 53800 000 14 300 18 224.2005 82 120 11800700 1.77 1800 18% 2003 25 109 130.50 2000 11.000 549 4001 BO 120 3:3800 2.000 270 1800 16/2003 154 $2.00 27 2.14 SL.000 67% 2003 104 148 133.00 25000 100 TOO 42 26/2003 95 165 133.00 2100 2.18 1700 42% 10/90/2003 104 18 13450 20000 18 11.000 05 24/2003 YES 8.5 144 120.40 000 20 11.450 70 2200 94 18 33.00 25000 3.50 5700 1945 Goth SA bud 11,100 200 500 41 1600 15 $1,1254 500 415 000 405 5700 419 STOO 4 11,5 40 2.500 SON 1200 4 2 2 1 0 Page 1 Top COURIER Performance Market Segment Analysis CI Decor, 2001 Access C134014 Performance 2.250 2.29 13 Performance statica Toy Unt Demand Andry Un Set of Total Industry Next Year's Growth Performance Customer Buying Criteria Expo 1 Rey MTB 22000-27000 2 Position 104 153 $24.50.450 4 Age Age 10 Peraturan Bar Sanmar Andreas Bild Chet Digby Ere Paris 40 295 19 06 20 605 * Plugin range Analysis COMER C 24 hod e Page . 3. IT 15 High State Trond Ays tegno New High End Customer buying reste E IP PH Vng H Age WA Rolety MTOF 20000 2000 4P 10.00 Perceptual Map for End Samant alumas Budi Chesi Digby Ere Ferris -XM por con 2 202314 Mightne 20 105 ad illil ON P in Hloh Fnd Segment tre DEO Agu WS VRE w 20 M1000 Fra Mapa de CHIN Land 20% 20 155 1 ION Top Products in Low End Segment cu Sud 19 18 V QUIE AA 12000 1350 AN 50 101 14000 w 1.100 son Real Are CO 1670 VE 30 GYS 30 TS 11 11 w st PE NE NE WE . ES CONCLOT PE GES TIH DO 20 440 w VE WE NO 14 WE DOS SELE 4010011 101 14 13 . NE 21.00 100 3.100 w 23 COLD BORDE 16 ca 1 65 MOVES MATE Puy- porte Top Products in Traditional segment use Page LOONE E UN . 1, COM COD 44 M 31 wt NIN re Or S4 ON 1 wy NOW 14.00 DUN 2000 14 55 165 C 347 10 244 3 118 Det e W YES to 4200 w Y30 100 A W Y 30 TA RO TO CUSTOMEOWER 1 MN + . 001 70 1 BILA 19 WWW Too Hard Late Sets CAN COURIER CONE 18 And AS 11 Ches Di Die Paris we Low Costume F 1 51450450 A 70 SP MTA 700000 100% SALAS ON 201 7 Page Traditional Martement Analysis Top COURTIER Da Access 134 Trond 7.80 Tata Static Thomas Actu industry Segment of Industry Newan Segment with Anda 72 20 Traditional Customer Buying Crea Center Digby Ene Fers 1. A Ideal 20 2 Price 519 10.2010 3. Po P57145 MTB 1000-19000 Perceptual Map for Traditional Segment end of 23 215 20% SON ROS SOON As Pontiana Share 202315404 Tradition 205 155 Illu 10% 0 Production Information Adam Primary Units en Unt Auto Name Segment Sold sory Revision Data Dec 31 MTBF Coord Coord Price Pim Size Materw shot Conte OverNet Shimation C Cou Cost Marg Next Pa me Round Round Able Trad 1.430 3/21/2023 Are 1,860 24 10000 5.5 1/22/2023 14.4528.49 $11.15 175 12% 58 12500 0% 65 3.0 High ON ASO 0 170 32140 56.00 540 33% 10/2/2023 90 14 23000 JAR Pin 14001 407 90 0 110 538 3153097 37% 50/2003 0% 99 30 21 27000 Agape 000 S 4:20 155 $34.99 $15.74 187 298 o W102023 20 21000 0% 44 30 10.1 5349 $13.91 1897 % 090 0 ON 30 6300 Baker Trad 1.682 1.323 324/2023 24 10000 Bond Low 2.000 55 144 127 00 311.15 19.21 0 17% 50 1292023 40 5.6 10000 Bid 1000 1001 3.0 High 834 133 170 120.00 965 57.72 22% 40% 125.2023 17 25000 50 1400 14 Dod Pren O 1.8 13700 318.55 731 010 100 18/2023 30 21 27000 0085 04 Buddy S 405 285 3/10/2023 154 55200 $18.44 $0.77 122 30 600 W 2.9 20000 40 108 51200 1165 294 1 30 10 N Cake Trad 1,345 825 1/19/2023 24 17100 58 Cedar 145 $7000 510 50 22 21% 11% 40 Low 1.60 3 1.100 101 4/23/2003 3.1 14000 34 170 121.00 172 3746 20 0 Cid 1,400 120 High 426 18 2/24/2003 18 23000 62 120 338.00 31496 36.07 ON 30 100 45 Com Porn 373 140 2/18/2003 22 25000 05 165 $3300 $1430 5897 23 30 600 75 Cure Size 401 236 2/24/2023 22 10000 42 110933.00 $12.00 58.97 29% 0 20 40000 Da Trad 337 9/27/2023 23 17500 62 138 528.00 311 $7.85 296 09 45 1.821 54 Dell 12 6/3/2023 3.1 14000 3.5 168 121.00 $751 $7:31 209 55 1.500 1919 Duck 462 00 W19/2023 1.5 23000 BO 11.100 315.76 597 34% 1024 Dot Pran 356 25 962023 1.9 25000 10.4 14.8 $33.00 $15.00 0.97 25% 0% 35 701 SIN Dune Size 375 17 96/2023 20 18000 47 100 33.00 $13.47 $0.97 32% 0 3.5 165 EM Trad 635 742 11/21/2010 4.1 17500 55 145 $28.00 $1005 37.55 239 40 1 800 55 Ebb D Low 5/25/2018 5.6 14000 30 50 170121.00 $705 57.46 29% 1400 129% 4/19/2021 33% 2.7 23000 Echo 3.0 8.0 High 900 120 338.00 $14.84 58.37 308 45% Pin 6/29/2020 21N 3.5 25000 313 3.0 94 201 600 73 155 $33.00 $1481 497 30 40 600635 26 110 53300 $12.00 58.07 Egg Size 215 5/24/2020 223 3.8 19000 40 1.2009 35% 5.6 145 529.50 $10.70 57 85 Trad 3/3/2093 Fast 2.5 17500 1.215 50 32% 1.000 1655 17,0 $22.00 $6.75 $7.98 3.0 1,673 Feat Low 5.6 13000 1/15/2023 0 500 49% 30 91 Fi 10.9 339 50 516 28 $8.98 30% 107 High 379 12/22/2023 14 24000 40 200 sex Pimn Foam 63 361 148 $34.50 $16.11 $8.20% 11/10/2023 106 18 20000 4.0 000 SON 47 9.6 $34.50 513.73 $8.98 34% Fume Size 284 18 19000 78 12/10/2023 Page 4 99392 393 3935% 39953 32 2331 ElEx Low 1.002 1.716 1841 Edge 359,70 149.474 135.134 13:44 10.03 1.41 MO 101 123 Total Latitis & Owners 3117,370 $14.00 510467 3116 3100 31 . Diy $100,7 574420 531,341 Income Statement Burvey tales Variable costs Labor Maria Car Contribution Margin Depreciation SOA (RAD Promo, Sales Admin) Other Fees, Witch, TOMB) EBIT Interest (Short form, Long to Taxes Profit Sharing Net Prot CAPSTONE COURIER Paris Sto 7. $1472 Andrews 13. 387,751 143.017 30,320 $22.570 $950 $11,071 7.87 51,220 Baldwin 5145.300 $114, M5 $50,64 37.567 $13.770 $300 10.00 58,465 123 511 5532 Chester $110.00 56472 530,100 37.58 $11.254 $50 $14,200 35,674 13.050 5113 35.552 Er 18 27 23 $77 19.872 50 $12,321 3500 12 9.142 $250 . 31.08 $1.000 $18.91 14,7 $1,003 1112 SSOS Page 3 16.30 $175 te 5310 510 5471 $2.236 Top Production Analysis CAPSTONE COURIER C134994 Round: Decr. 2003 Production vs Capacity C134274 Andrews Baldwin Chester Digby Etie Ferris 0 500 1.000 1.500 2.000 2.500 3.000 3.500 4.000 4.500 5.000 6.500 6.000 6.500 7.000 Capacity Production y did PE 15.000 30 10 10 GO 09 90 210 M 0 2015 1 10 C Com from 30 16 WS SH 122 1400 304 HE (114541 11 THER . w Natchange in cash portion Balance Sheet Survey Joanh Accue S. And $14.000 05 174 05 06 10 $13.54 HO $10,142 13.00 11.000 STO SZT.013 Toe To I ER VISES DOBIE OWENIG 00 A Deprem 2531 10 33,00 70 FO PEN 347377 CH 1830 INOU 154 Total Assets STON SMM SI Acco Current 18.00 1400 58.48 . 30.10 004 CHE E WORLD 59 37.00 HO 3564 1.100 31. 14100 5504 SEP 19 Long Term Date Tw Como Redang 500 $ BIM 20, 33514 500 PM Se 550,170 4 SIM. 51195 1104 . 3100 ST Total & Owners E Andrew Du 0670 20 A HER 1 S4300 11454 WWE DEE 1901 14 334 Cher 18. ST 3310 11 S124 350 incrementurvey M. Carmi Con Margie Deprec SCANDA Om Wie TOM ERIT Lang B. 543017 12.50 100 BOTT CE 19,500 133318 37 58 BES $13.71 100 09 ORIS LATES 100 51486 SEE POH SUS 31220 SER * CS 015 310 16 hog Cher SINESS 140 w 10 120 bons M ty 1104 12 14.00 36.2003 ARA DO 12 19000000 NE NG NE WE 134 22 Erle R&R 8888 M. 0.000 2002 00 NO 1215 100 1883 Femi PO 010 COLO 126 New Year P7501 CAPSTONE COUBER Page Top COURIER Ca Financial C1 Deco And Cher Ferra 15.5 1471 PS Cash Fon Statement Servey Cash flow from pasting titi . .ch there Changes in current Acourt Inventory Account 27 10.30 05 0 EM 52001 5731 3. 30 14 18 $3.013 34813) 333 I WEWE 160 IS 31.10 BSP ST. SETIS W 5330 20 06 33 BERCE 30 10 Cash flow from investing Cashflows fronting i Jound Solomon Pof comment ww 1 2016 B 0 6 RRRRR! 30 30 SI 30 15 Stics & Bonde CESIN Dr. Clou SOD COURIER Stock Market Summary Marbet Book (SM Per Share 2.000000 2.07 1:24 2.000.000 2.000.000 352 5242 2.000.000 12 2.000.000 125 Dwind PE 103 $10 Iw 65 15 5095 Company And Band Ich Diy En Fene EPS $123 1028 52.70 5224 30 Yield 00N 0.0% $35 12 ST 120 2 27. 900 06 0000 606 DOM 1045 SERS MU WO (5828 (164) 55 3000 1000 0$ 00 14 14 1895 Closing Stock Price 634274 550 550 3401 Andrews ob Chester Digby Ere Fem OCS 520 $10 50 2002 2023 2024 2099 2007 2020 Bond Market Summary SAP Face Yield Company Adres POUSO 11.1% 12 SO S8.900.000 1.200.000 $14,000 150.00 10634 WELL HOS 1215 8888 8888 09 Baldwin 11 05.2004 55.00 TAS 50.000 900.000 $300.000 112 20 13:45 123 2 100 910 Andrews 1. 10 9 Ferra NOW ROS Asset Turnover ROA Leverage Aalay ROE Emergency Loan Sales EBIT Profit Cumulative Profit SCLA/ Sales Contrib, Margin 115 Selected Financial Statistics Baldwin Chester Diphy 04% 47 0.4% 1.17 1.13 08 0.4% 53% 04 25 20 2.4 10:45 10 $15.101.100 55 310.150411 5145308,643 $15.02.216 5104,786,75 50.300.432 514.209.170 18.882 213 1530472 15.51791 5471300 54.720.070 $9,740 200 S4650897 8.0 9.5% 116 213% 2015 200 4 50 6,014 $11.77007 2.235707 56,424.215 17.15 33.4% Erle 04N 0 ON 2.1 075 56.004.16 5.295.231 56,100,105 $317.60 SA 1121 103 20 12 30 $ 313.11.10 35.465.00 054.117 33 Percent of Sales C134274 S Market Share C134274 Profit Other OSOA Dep! O Vw Cost 100% 905 B0% 70% 80% 50% 40% 30% 20% 10% ON Andres 1895 Baldwin 2030 Chester 1696 Digby 15.95 Ere 123 Ferris 1677 Ere Ferris Andrews Chester Digby Page 1 CAPSTONE COURIER Name Pimno Size MTBF Revision Date Age at Revision RAD Cost Baker 5.5 14.4 17.0 10 Bead Perceptual Map (at end of this year) 2 18 16 14 3.0 80 50 Bid 19000 16000 25000 27000 20000 11.8 Bold 9.4 12 15.4 10.8 50 50 50 4.0 S24 Buddy NA 3 0.0 0.0 NA 50 $0 0.0 00 4 2 NA 0.0 0.0 0 $0 0246 10 12 14 16 18 20 Performance Total 50 Material Cost Age Profile 75 51833 tead 63.31 sic Perceived Age in Years Bold BY so 1125 125 SIS 588 55 375 $10 Material Cost in dollars New Material Cost Old Material Cost Bead Ed Hold-uddy Each year, the segments drift the length of the hypotenuse of the triangle formed by customers' desire for smaller and faster products. Table 1 Segment Circle Drift Rates: Every year, customers demand increased performance (Pfmn) and decreased size. Note that the drift rates vary for each segment. 0.5 Traditional Low End High End Performance Size Pimn +0.7 +0.5 +0.9 +1.0 +0.7 Size -0.7 -0.5 -0.9 -0.7 - 1.0 Segment Centers Table 2 Segment Centers at the End of Each Round: As shown in the Perceptual Map Form above, size is on the vertical axis and performance (Pfmn) is on the horizontal axis. Size Round 0 1 OOO 2 3 Traditional Pimn 5.0 5.7 6.4 7,1 7.8 8.5 9.2 9.9 10.6 CON Low End Pimn 2.5 3.0 3.5 4.0 4.5 5.0 5.5 6.0 6.5 15.0 14.3 13.6 12.9 12.2 11.5 10.8 10.1 9.4 Size 17.5 17.0 16.5 16.0 15.5 15.0 14.5 14.0 13,5 High End Pfmn 7.5 8.4 9.3 10.2 11.1 12.0 12.9 13.8 14.7 Size 12.5 11.6 10.7 9.8 8.9 8.0 Performance Pimn 8.0 9.0 10.0 11.0 12.0 13.0 14.0 15.0 16.0 Size 17.0 16.3 15.6 14.9 14.2 13.5 12.8 12.1 11.4 Size Pimn 3.0 3.7 4.4 5.1 5.8 6.5 7.2 7.9 8.6 Size 12.0 11.0 100 9.0 8.0 7.0 6.0 5.0 4.0 GO 4 5 7.1 6 7 DO o o 6.2 5.3 8 The information in Table 2 reflects the segment centers at the end of the round. Therefore, the Round 0 positions can be seen as the Round 1 starting positions, Round 2 positions can be seen as the Round 3 starting position, etc. Each month during the simulation year, the segment drifts 1/12th of the distance from the starting position to the ending position. Ideal Spots Table 3 Ideal Spot Offsets: Customers prefer products located this distance from the center of the segment circle. Traditional Low End High End Performance Size Pimn 0.0 -0.8 +1.4 +1.4 +1.0 Size 0.0 +0.8 -1.4 -1.0 -1.4 The information in Table 3 shows the Ideal Spot "offsets or distances from the segment center. The ideal spot is that point where, all other things being equal, demand is highest. It is different from the segment center. Why are some ideal spots ahead of the segment centers? The segments are moving. From a customer's perspective, if they buy a product at the ideal spot, it will still be a cutting edge product when it wears out. 2 Segment Sizes and Growth Rates At the beginning of the simulation, Traditional and Low End sell more units than the high technology segments, High End, Performance and Size. Page 10 of the Capstone Courier, the Market Segment Report, displays total industry sales. Each market segment grows at a different rate. Table 4 lists the beginning segment growth rates for your industry. The growth rates might change from year to year. Check the Segment Analysis reports in the Capstone Courier each round for the upcoming year's growth rates. Table 4 Beginning Segment Growth Rates Traditional 6.7% Low End 13.8% High End 20.2% Performance 16.9% Size 15.9% 3 Buying Criteria By Segment These are your products and the primary segments they sell into at the beginning of the simulation. These can change according to your decisions and as the simulation evolves. ROUW Table 4 Beginning Segment Growth Rates Traditional 6.79 Low End 13.8% High End 20.2% Performance 10.9% Size 15.9% 3 Buying Criteria By Segment These are your products and the primary segments they sell into at the beginning of the simulation. These can change according to your decisions and as the simulation evolves Baker Traditional Bead Low End Bid High End Bold Performance Buddy Size The buying criteria for each segment, in order of importance, are displayed below. Positioning and Age score information also display. Passing your cursor over an image will enlarge it. See Chapter 3 of the Team Member Guide for explanations of Positioning, Age, Price and MTBF scores. 3.1 Traditional Segment Buying Criteria (Round ) Traditional customers seek proven products at a modest price. Age, 2 years - Importance: 47% Price, $20.00-$30.00 - importance: 23% Ideal Position, performance 5.0 size 15.0 - importance: 21% MTBF 14,000-19,000 - importance: 9% Industry Conditions Figure 3.1: Traditional Buying Criteria ON 21% Industry Conditions Figure 3.1: Traditional Buying Criteria POLONING 21% MTE 9% PRICE 23% AGE 47% Better Poorer Traditional customers give higher position scores to sensors located in the center of the segment circle. Better n Poorer 0 1 2 3 4 5 Traditional customers give higher scores to sensors in the 2 year range. 3.2 Low End Segment Buying Criteria (Round 0) Low End customers seek low prices and well proven products. Price, $15.00-$25.00 - importance: 53% Age, 7 years - importance: 24% Ideal Position, performance 1.7 size 18.3 - importance: 16% 100 - importance: 7% . industry conditions Figure 3.2 LOW Ena suying uriens Low End customers preferensvestors with slower performance and large wire Low End customers give higher scores to sensors in the year range 3.3 High End Segment Buying Criteria (Round 0) High End customers seek cutting edge technology in ne/performance and new designs Ideal Position, performance 8.9 size 11.1 - Importance: 43% Age 0 years importance: 29% MTBF 20.000-25,000 - Importance: 1996 Price $30.00 $40.00 - importance: 9% Industry Conditions Four 33 High End Buying Critena Industry Conditions Figure 3.4 Performance Buying Criteria RE Puromance customers Performance or wintersey 3.5 Sze Segmont Buying Criteria Round) Sire customers cuing edge technology and younger Gigs Potce 106mporta Asymportance . 16.000.000 - mono 103 . Pro 25.00-$35.00 morte Industry Conditions For Bing Criteris Industry Condition Figure 3.5 Sure Buying Criteria BAND Size customen emphasize ver performance Size customers professors in the 15 year range 4 Projected Interest Rates Pienst Rate Round 7.0 Tour Lane, Sute 108 aprIL 60663 E Andrews 174 113 w 634 NO Tervis 50 123 21 20 120 ** Selected Financial Statistics Chester Digly 04 1.17 13 001 04 23 20 24 100 LON 3.11.10 140.15241 S3 372282210 SOMA 12.306292 $324 2010 10. 2015 BOS Assets ROA Laverage Aitant ROE Erreny Lan EDIT Profit Cum Probet SGLAS M 08 30.04. 33 4 5132014 SH 12. . 35.4 05 TOS BMW 3310 58 ww METE w WE w NO SELE 17 WE Percent of 134274 S Market Share C134274 son Prot OSSA De DV Costs DON 70 60 NEW 40 30 20 10 NOE 20365 Che Dohy 165 En 1675 Che Digby Fans CAPSTONE COURIER CAN 2000 Son & TOR COURTIER Stock Market Summary Share Perhe V PE Cluse Change MM Didend 3000 Need Complement Complement 1 Shi Complement 2nd SN Complement HUMAN RESOURCES SUMMARY And Dawi CM 712 1.100 574 712 1.100 874 642 ATT 780 63 316 94 Diy 650 680 014 45 E 701 701 600 Furn 835 695 141 06 dos 00% 10:08 OX 0 0 66 0.0% 100N 71 100% 00% 100% 261 0 Overtine's Tumhver Rate Now players theparated Em Routing Spord Training Hours Productivity OON 100 612 0 10 0 100 65 o 10 0 1000 . 1000 30 0 1000 SO 0 1000% 0 100DN Recruiting Cool feparation Coul training Cou To A Cost 383 50 50 SD 3012 30 SO 5012 2261 50 50 50 50 1271 50 vo 371 14 3335 10 1201 Labor Contract Next Year Wages Benes Pro Sharing Annual Raise 122.95 2.500 2.0 12200 2.500 2.0 5. 7.500 20% SON 122.05 2.500 2.05 SON 52205 2.500 2014 50% 53205 7.500 2.0% SON Starting Negotiation Position Wages Bares Profit Sharing Ar Raise Celing Negotiation Position Wages Benefits Profit Sharing AR Adjusted Labor Demande Wages Size Market Segment Analysis CAPSYONE COURIER C134274 Round: 1 December 31, 2023 Accessibility C134274 Size Andrews Size Statistics Total Industry Unit Demand Actual Industry Unit Sales Segment % of Total Industry Next Year's Segment Growth Rate 2.299 2,299 8.9% Baldwin 17.3% Chester Digby Erie Ferris Size Customer Buying Criteria Expectations Importance 1. Ideal Position Pimn 4.7 Size 9.6 43% 2 Age Ideal Age 15 29% 3. Reliability MTBF 16000-21000 19% 4. Price $24.50 - 34.50 9% Perceptual Map for Size Segment Peroeptual map (at end of this year 0% 20% 40% 60% 80% 100% Actual vs Potential Market Share 2023 C134274 Size 20% Dise 15% Ahme 10% Ege De 10 5% 0% 4 O Actual Potential Per 12 14 16 17 18 4 Age 19% MES del A10 Perceptual Map for Performance Segment 30%, 100% Achals Poteris Market Share 2023 134274 Performance 25% D 20% 15% 10N On Andrews Actual Potenta TO Top Products in Performance Segment Dec Cut Survey 2 98 20 Units Mart Sold to Name Share Seg Bold 25% AR 17% 39 Coat 15% 342 Foam 15% 333 Dot 14% 318 13 209 Raker 0% 4 Able 0% 3 Cake 0% 2 Daze 0% Fast 0% 1 3700 List Age Promo Art Price MTBF Dec.31 Budget $32.00 27000 2.14 $1.000 52% $340 27000 208 51.400 605 $3300 25000 2.18 5700 424 $3450 20000 1.81 $1.000 53 $53.00 25000 150 43 $3300 25000 3.50 $700 52700 19000 243 51.300 67 $26.4919000 24) $1.400 70 $28.00 17500 2.44 $1.200 85% 5:28 DO 17500 226 $1,000 so $29.50 17500 24 $1,100 61% Revision Stock PS Date Out Coord Coord 3/10/2022 94 154 53/2003 YES 99 155 2/18/2020 2.5 155 11/10/2023 106 143 62023 104 148 622020 94 155 3/24/2073 65 144 1242093 YES 55 144 3/192022 5.8 145 7127/2003 62 13.6 33/2023 56 145 Cust Sales Aces Budget 31.000 335 $2.500 515 5700 20% $1,175 35% 3700 5700 29 $1.300 334 5200 51% $1.100 293 31000 201 $1.17535% ON 15 Edge o 0 ge Du Sarney IT 31 29 Mar 50 Name 215 64 Aca 568 Du 155 IC 14 28 125 37 Ech 105 06 Bold 2 56 15 37 Coa 31 Foan 29 24 Ede 11 CAPSTONES COURIER Top Products in High End Segment ON O Out Ae Coordon Pre Pro MF Desi 2203 80 118 53700 25000 1.71 31,900 10/22022 YES 110 S300 21000 1.44 1.400 es 2923 39 112 53800 000 14 300 18 224.2005 82 120 11800700 1.77 1800 18% 2003 25 109 130.50 2000 11.000 549 4001 BO 120 3:3800 2.000 270 1800 16/2003 154 $2.00 27 2.14 SL.000 67% 2003 104 148 133.00 25000 100 TOO 42 26/2003 95 165 133.00 2100 2.18 1700 42% 10/90/2003 104 18 13450 20000 18 11.000 05 24/2003 YES 8.5 144 120.40 000 20 11.450 70 2200 94 18 33.00 25000 3.50 5700 1945 Goth SA bud 11,100 200 500 41 1600 15 $1,1254 500 415 000 405 5700 419 STOO 4 11,5 40 2.500 SON 1200 4 2 2 1 0 Page 1 Top COURIER Performance Market Segment Analysis CI Decor, 2001 Access C134014 Performance 2.250 2.29 13 Performance statica Toy Unt Demand Andry Un Set of Total Industry Next Year's Growth Performance Customer Buying Criteria Expo 1 Rey MTB 22000-27000 2 Position 104 153 $24.50.450 4 Age Age 10 Peraturan Bar Sanmar Andreas Bild Chet Digby Ere Paris 40 295 19 06 20 605 * Plugin range Analysis COMER C 24 hod e Page . 3. IT 15 High State Trond Ays tegno New High End Customer buying reste E IP PH Vng H Age WA Rolety MTOF 20000 2000 4P 10.00 Perceptual Map for End Samant alumas Budi Chesi Digby Ere Ferris -XM por con 2 202314 Mightne 20 105 ad illil ON P in Hloh Fnd Segment tre DEO Agu WS VRE w 20 M1000 Fra Mapa de CHIN Land 20% 20 155 1 ION Top Products in Low End Segment cu Sud 19 18 V QUIE AA 12000 1350 AN 50 101 14000 w 1.100 son Real Are CO 1670 VE 30 GYS 30 TS 11 11 w st PE NE NE WE . ES CONCLOT PE GES TIH DO 20 440 w VE WE NO 14 WE DOS SELE 4010011 101 14 13 . NE 21.00 100 3.100 w 23 COLD BORDE 16 ca 1 65 MOVES MATE Puy- porte Top Products in Traditional segment use Page LOONE E UN . 1, COM COD 44 M 31 wt NIN re Or S4 ON 1 wy NOW 14.00 DUN 2000 14 55 165 C 347 10 244 3 118 Det e W YES to 4200 w Y30 100 A W Y 30 TA RO TO CUSTOMEOWER 1 MN + . 001 70 1 BILA 19 WWW Too Hard Late Sets CAN COURIER CONE 18 And AS 11 Ches Di Die Paris we Low Costume F 1 51450450 A 70 SP MTA 700000 100% SALAS ON 201 7 Page Traditional Martement Analysis Top COURTIER Da Access 134 Trond 7.80 Tata Static Thomas Actu industry Segment of Industry Newan Segment with Anda 72 20 Traditional Customer Buying Crea Center Digby Ene Fers 1. A Ideal 20 2 Price 519 10.2010 3. Po P57145 MTB 1000-19000 Perceptual Map for Traditional Segment end of 23 215 20% SON ROS SOON As Pontiana Share 202315404 Tradition 205 155 Illu 10% 0 Production Information Adam Primary Units en Unt Auto Name Segment Sold sory Revision Data Dec 31 MTBF Coord Coord Price Pim Size Materw shot Conte OverNet Shimation C Cou Cost Marg Next Pa me Round Round Able Trad 1.430 3/21/2023 Are 1,860 24 10000 5.5 1/22/2023 14.4528.49 $11.15 175 12% 58 12500 0% 65 3.0 High ON ASO 0 170 32140 56.00 540 33% 10/2/2023 90 14 23000 JAR Pin 14001 407 90 0 110 538 3153097 37% 50/2003 0% 99 30 21 27000 Agape 000 S 4:20 155 $34.99 $15.74 187 298 o W102023 20 21000 0% 44 30 10.1 5349 $13.91 1897 % 090 0 ON 30 6300 Baker Trad 1.682 1.323 324/2023 24 10000 Bond Low 2.000 55 144 127 00 311.15 19.21 0 17% 50 1292023 40 5.6 10000 Bid 1000 1001 3.0 High 834 133 170 120.00 965 57.72 22% 40% 125.2023 17 25000 50 1400 14 Dod Pren O 1.8 13700 318.55 731 010 100 18/2023 30 21 27000 0085 04 Buddy S 405 285 3/10/2023 154 55200 $18.44 $0.77 122 30 600 W 2.9 20000 40 108 51200 1165 294 1 30 10 N Cake Trad 1,345 825 1/19/2023 24 17100 58 Cedar 145 $7000 510 50 22 21% 11% 40 Low 1.60 3 1.100 101 4/23/2003 3.1 14000 34 170 121.00 172 3746 20 0 Cid 1,400 120 High 426 18 2/24/2003 18 23000 62 120 338.00 31496 36.07 ON 30 100 45 Com Porn 373 140 2/18/2003 22 25000 05 165 $3300 $1430 5897 23 30 600 75 Cure Size 401 236 2/24/2023 22 10000 42 110933.00 $12.00 58.97 29% 0 20 40000 Da Trad 337 9/27/2023 23 17500 62 138 528.00 311 $7.85 296 09 45 1.821 54 Dell 12 6/3/2023 3.1 14000 3.5 168 121.00 $751 $7:31 209 55 1.500 1919 Duck 462 00 W19/2023 1.5 23000 BO 11.100 315.76 597 34% 1024 Dot Pran 356 25 962023 1.9 25000 10.4 14.8 $33.00 $15.00 0.97 25% 0% 35 701 SIN Dune Size 375 17 96/2023 20 18000 47 100 33.00 $13.47 $0.97 32% 0 3.5 165 EM Trad 635 742 11/21/2010 4.1 17500 55 145 $28.00 $1005 37.55 239 40 1 800 55 Ebb D Low 5/25/2018 5.6 14000 30 50 170121.00 $705 57.46 29% 1400 129% 4/19/2021 33% 2.7 23000 Echo 3.0 8.0 High 900 120 338.00 $14.84 58.37 308 45% Pin 6/29/2020 21N 3.5 25000 313 3.0 94 201 600 73 155 $33.00 $1481 497 30 40 600635 26 110 53300 $12.00 58.07 Egg Size 215 5/24/2020 223 3.8 19000 40 1.2009 35% 5.6 145 529.50 $10.70 57 85 Trad 3/3/2093 Fast 2.5 17500 1.215 50 32% 1.000 1655 17,0 $22.00 $6.75 $7.98 3.0 1,673 Feat Low 5.6 13000 1/15/2023 0 500 49% 30 91 Fi 10.9 339 50 516 28 $8.98 30% 107 High 379 12/22/2023 14 24000 40 200 sex Pimn Foam 63 361 148 $34.50 $16.11 $8.20% 11/10/2023 106 18 20000 4.0 000 SON 47 9.6 $34.50 513.73 $8.98 34% Fume Size 284 18 19000 78 12/10/2023 Page 4 99392 393 3935% 39953 32 2331 ElEx Low 1.002 1.716 1841 Edge 359,70 149.474 135.134 13:44 10.03 1.41 MO 101 123 Total Latitis & Owners 3117,370 $14.00 510467 3116 3100 31 . Diy $100,7 574420 531,341 Income Statement Burvey tales Variable costs Labor Maria Car Contribution Margin Depreciation SOA (RAD Promo, Sales Admin) Other Fees, Witch, TOMB) EBIT Interest (Short form, Long to Taxes Profit Sharing Net Prot CAPSTONE COURIER Paris Sto 7. $1472 Andrews 13. 387,751 143.017 30,320 $22.570 $950 $11,071 7.87 51,220 Baldwin 5145.300 $114, M5 $50,64 37.567 $13.770 $300 10.00 58,465 123 511 5532 Chester $110.00 56472 530,100 37.58 $11.254 $50 $14,200 35,674 13.050 5113 35.552 Er 18 27 23 $77 19.872 50 $12,321 3500 12 9.142 $250 . 31.08 $1.000 $18.91 14,7 $1,003 1112 SSOS Page 3 16.30 $175 te 5310 510 5471 $2.236 Top Production Analysis CAPSTONE COURIER C134994 Round: Decr. 2003 Production vs Capacity C134274 Andrews Baldwin Chester Digby Etie Ferris 0 500 1.000 1.500 2.000 2.500 3.000 3.500 4.000 4.500 5.000 6.500 6.000 6.500 7.000 Capacity Production y did PE 15.000 30 10 10 GO 09 90 210 M 0 2015 1 10 C Com from 30 16 WS SH 122 1400 304 HE (114541 11 THER . w Natchange in cash portion Balance Sheet Survey Joanh Accue S. And $14.000 05 174 05 06 10 $13.54 HO $10,142 13.00 11.000 STO SZT.013 Toe To I ER VISES DOBIE OWENIG 00 A Deprem 2531 10 33,00 70 FO PEN 347377 CH 1830 INOU 154 Total Assets STON SMM SI Acco Current 18.00 1400 58.48 . 30.10 004 CHE E WORLD 59 37.00 HO 3564 1.100 31. 14100 5504 SEP 19 Long Term Date Tw Como Redang 500 $ BIM 20, 33514 500 PM Se 550,170 4 SIM. 51195 1104 . 3100 ST Total & Owners E Andrew Du 0670 20 A HER 1 S4300 11454 WWE DEE 1901 14 334 Cher 18. ST 3310 11 S124 350 incrementurvey M. Carmi Con Margie Deprec SCANDA Om Wie TOM ERIT Lang B. 543017 12.50 100 BOTT CE 19,500 133318 37 58 BES $13.71 100 09 ORIS LATES 100 51486 SEE POH SUS 31220 SER * CS 015 310 16 hog Cher SINESS 140 w 10 120 bons M ty 1104 12 14.00 36.2003 ARA DO 12 19000000 NE NG NE WE 134 22 Erle R&R 8888 M. 0.000 2002 00 NO 1215 100 1883 Femi PO 010 COLO 126 New Year P7501 CAPSTONE COUBER Page Top COURIER Ca Financial C1 Deco And Cher Ferra 15.5 1471 PS Cash Fon Statement Servey Cash flow from pasting titi . .ch there Changes in current Acourt Inventory Account 27 10.30 05 0 EM 52001 5731 3. 30 14 18 $3.013 34813) 333 I WEWE 160 IS 31.10 BSP ST. SETIS W 5330 20 06 33 BERCE 30 10 Cash flow from investing Cashflows fronting i Jound Solomon Pof comment ww 1 2016 B 0 6 RRRRR! 30 30 SI 30 15 Stics & Bonde CESIN Dr. Clou SOD COURIER Stock Market Summary Marbet Book (SM Per Share 2.000000 2.07 1:24 2.000.000 2.000.000 352 5242 2.000.000 12 2.000.000 125 Dwind PE 103 $10 Iw 65 15 5095 Company And Band Ich Diy En Fene EPS $123 1028 52.70 5224 30 Yield 00N 0.0% $35 12 ST 120 2 27. 900 06 0000 606 DOM 1045 SERS MU WO (5828 (164) 55 3000 1000 0$ 00 14 14 1895 Closing Stock Price 634274 550 550 3401 Andrews ob Chester Digby Ere Fem OCS 520 $10 50 2002 2023 2024 2099 2007 2020 Bond Market Summary SAP Face Yield Company Adres POUSO 11.1% 12 SO S8.900.000 1.200.000 $14,000 150.00 10634 WELL HOS 1215 8888 8888 09 Baldwin 11 05.2004 55.00 TAS 50.000 900.000 $300.000 112 20 13:45 123 2 100 910 Andrews 1. 10 9 Ferra NOW ROS Asset Turnover ROA Leverage Aalay ROE Emergency Loan Sales EBIT Profit Cumulative Profit SCLA/ Sales Contrib, Margin 115 Selected Financial Statistics Baldwin Chester Diphy 04% 47 0.4% 1.17 1.13 08 0.4% 53% 04 25 20 2.4 10:45 10 $15.101.100 55 310.150411 5145308,643 $15.02.216 5104,786,75 50.300.432 514.209.170 18.882 213 1530472 15.51791 5471300 54.720.070 $9,740 200 S4650897 8.0 9.5% 116 213% 2015 200 4 50 6,014 $11.77007 2.235707 56,424.215 17.15 33.4% Erle 04N 0 ON 2.1 075 56.004.16 5.295.231 56,100,105 $317.60 SA 1121 103 20 12 30 $ 313.11.10 35.465.00 054.117 33 Percent of Sales C134274 S Market Share C134274 Profit Other OSOA Dep! O Vw Cost 100% 905 B0% 70% 80% 50% 40% 30% 20% 10% ON Andres 1895 Baldwin 2030 Chester 1696 Digby 15.95 Ere 123 Ferris 1677 Ere Ferris Andrews Chester Digby Page 1 CAPSTONE COURIER
Step by Step Solution
There are 3 Steps involved in it
1 Expert Approved Answer
Step: 1 Unlock

Question Has Been Solved by an Expert!
Get step-by-step solutions from verified subject matter experts
Step: 2 Unlock
Step: 3 Unlock