need solution of these problems
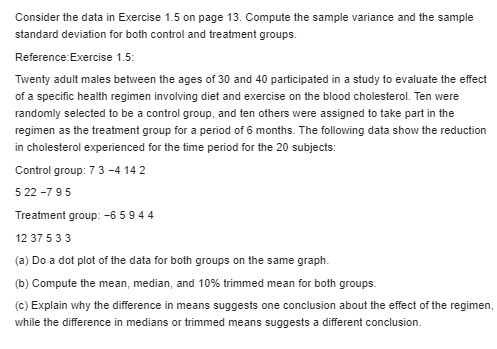
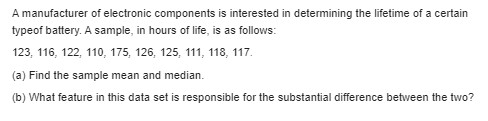
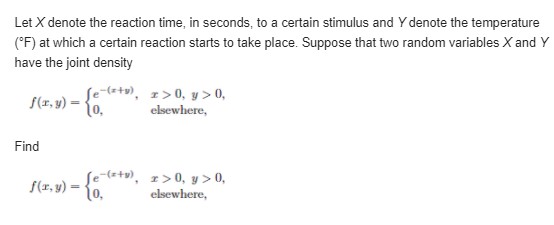
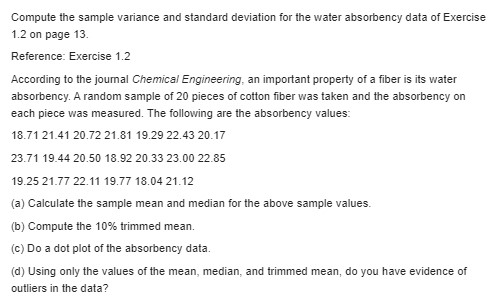
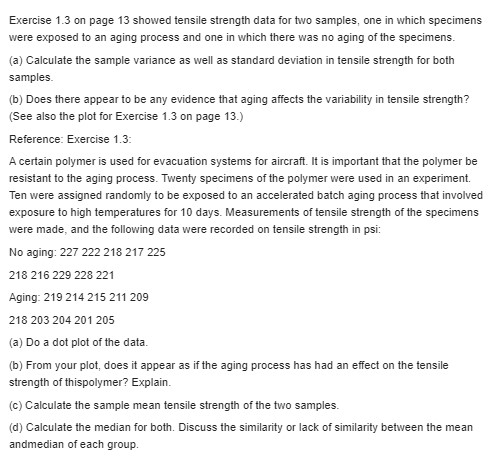
Consider the data in Exercise 1.5 on page 13. Compute the sample variance and the sample standard deviation for both control and treatment groups. Reference Exercise 1.5: Twenty adult males between the ages of 30 and 40 participated in a study to evaluate the effect of a specific health regimen involving diet and exercise on the blood cholesterol. Ten were randomly selected to be a control group, and ten others were assigned to take part in the regimen as the treatment group for a period of 6 months. The following data show the reduction in cholesterol experienced for the time period for the 20 subjects: Control group: 7 3 -4 14 2 522 -795 Treatment group: -6 5 9 4 4 12 37 5 3 3 (a) Do a dot plot of the data for both groups on the same graph. (b) Compute the mean, median, and 10% trimmed mean for both groups. (c) Explain why the difference in means suggests one conclusion about the effect of the regimen, while the difference in medians or trimmed means suggests a different conclusion.A manufacturer of electronic components is interested in determining the lifetime of a certain typeof battery. A sample, in hours of life, is as follows: 123, 116, 122, 110, 175, 126, 125, 111, 118, 117. (a) Find the sample mean and median. (b) What feature in this data set is responsible for the substantial difference between the two?\fLet X denote the reaction time, in seconds, to a certain stimulus and Y denote the temperature ("F) at which a certain reaction starts to take place. Suppose that two random variables X and Y have the joint density f(x, y) = 10. e-(sty). x>0, y>0. elsewhere, Find -(sty), r>0, y>0. f(x, y) = 10. elsewhere,Compute the sample variance and standard deviation for the water absorbency data of Exercise 1.2 on page 13. Reference: Exercise 1.2 According to the joumal Chemical Engineering, an important property of a fiber is its water absorbency. A random sample of 20 pieces of cotton fiber was taken and the absorbency on each piece was measured. The following are the absorbency values: 18.71 21.41 20.72 21.81 19.29 22.43 20.17 23.71 19.44 20.50 18.92 20.33 23.00 22.85 19.25 21.77 22.11 19.77 18.04 21.12 (a) Calculate the sample mean and median for the above sample values. (b) Compute the 10% trimmed mean. (c) Do a dot plot of the absorbency data. (d) Using only the values of the mean, median, and trimmed mean, do you have evidence of outliers in the data?Exercise 1.3 on page 13 showed tensile strength data for two samples, one in which specimens were exposed to an aging process and one in which there was no aging of the specimens. (a) Calculate the sample variance as well as standard deviation in tensile strength for both samples. (b) Does there appear to be any evidence that aging affects the variability in tensile strength? (See also the plot for Exercise 1.3 on page 13.) Reference: Exercise 1.3: A certain polymer is used for evacuation systems for aircraft. It is important that the polymer be resistant to the aging process. Twenty specimens of the polymer were used in an experiment. Ten were assigned randomly to be exposed to an accelerated batch aging process that involved exposure to high temperatures for 10 days. Measurements of tensile strength of the specimens were made, and the following data were recorded on tensile strength in psi: No aging: 227 222 218 217 225 218 216 229 228 221 Aging: 219 214 215 211 209 218 203 204 201 205 (a) Do a dot plot of the data. (b) From your plot, does it appear as if the aging process has had an effect on the tensile strength of thispolymer? Explain. (c) Calculate the sample mean tensile strength of the two samples. (d) Calculate the median for both. Discuss the similarity or lack of similarity between the mean andmedian of each group