Need some help with my assignments in statistics and probability
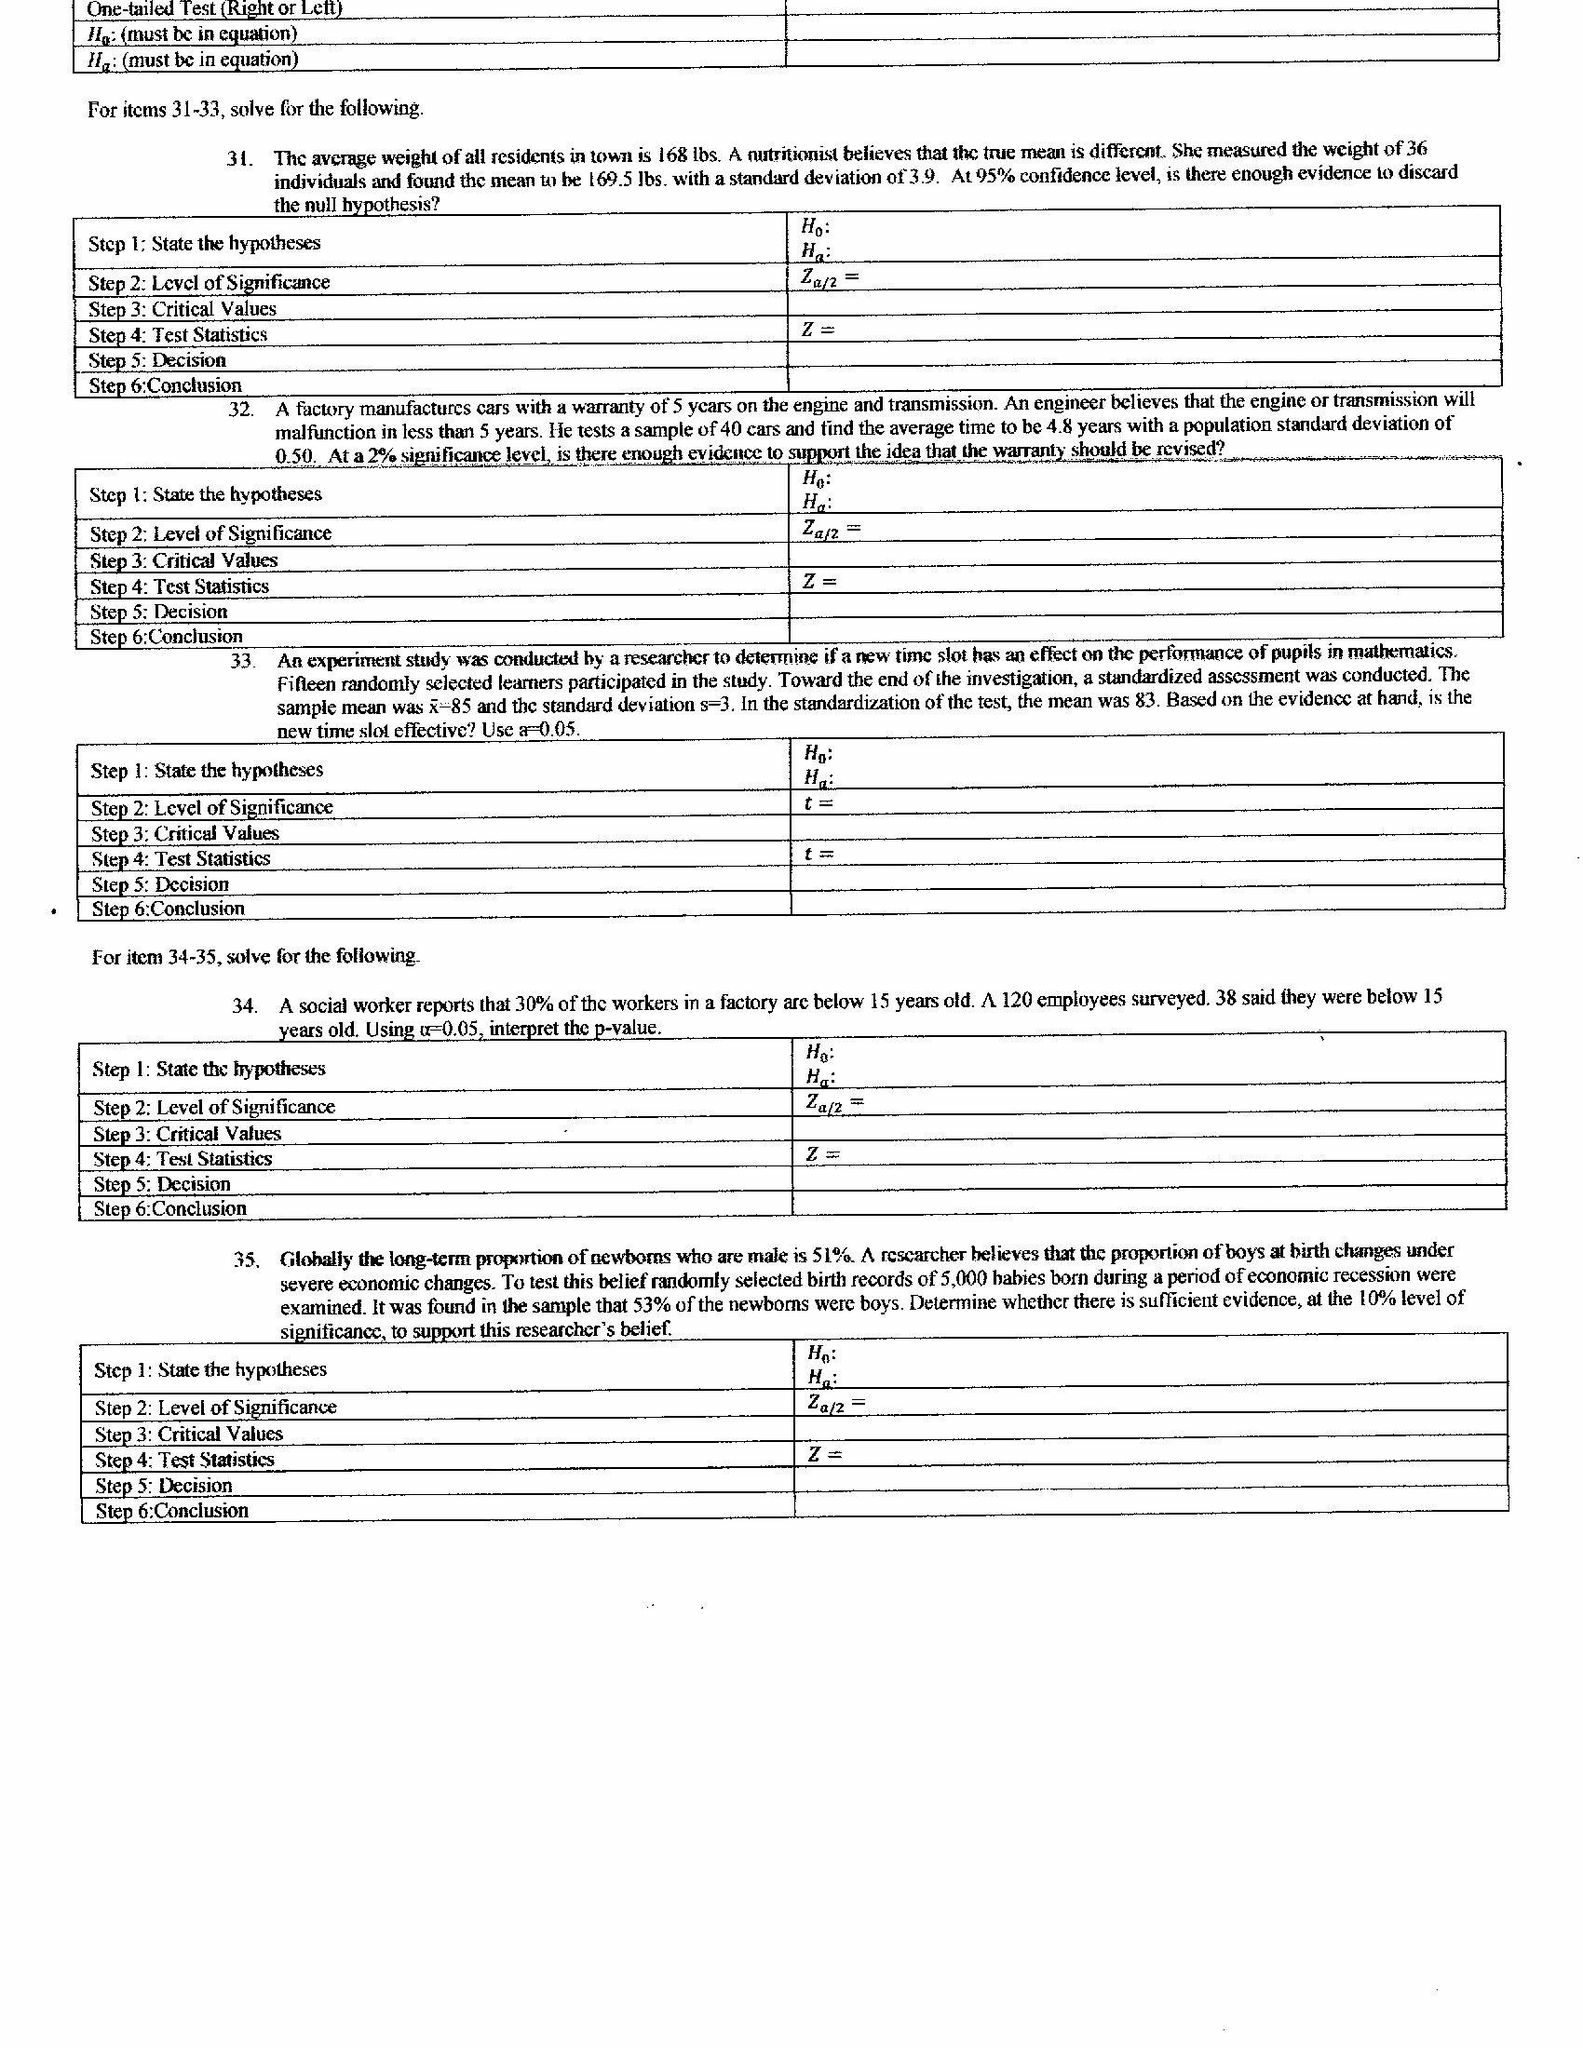
One-tailed Test (Right or Left) I1: (must be in equation) Ha: (must be in equation) For items 31-33, solve for the following. 31. The average weight of all residents in town is 168 Ibs. A nutritionist believes that the true mean is different. She measured the weight of 36 individuals and found the mean to be 169.5 Ibs. with a standard deviation of 3.9. At 95% confidence level, is there enough evidence to discard he null hypothesis? Step 1; State the hypotheses Ho: Step 2: Level of Significance Za/ = Step 3: Critical Values Step 4: Test Statistics Z= Step 5: Decision Step 6:Conclusion 32. A factory manufactures cars with a warranty of 5 years on the engine and transmission. An engineer believes that the engine or transmission will malfunction in less than 5 years. He tests a sample of 40 cars and find the average time to be 4.8 years with a population standard deviation of 0.50. At a 2% significance level, is there enough evidence to support the idea that the warranty should be revised? Step 1: State the hypotheses He: Step 2; Level of Significance Zan= Step 3: Critical Values Step 4: Test Statistics Z = Step 5: Decision Step 6: Conclusion 33. An experiment study was conducted by a researcher to determine if a new time slot has an effect on the performance of pupils in mathematics. Fifteen randomly selected learners participated in the study. Toward the end of the investigation, a standardized assessment was conducted. The sample mean was x-85 and the standard deviation s=3. In the standardization of the test, the mean was 83. Based on the evidence at hand, is the new time slot effective? Use a 0.05. Step 1: State the hypotheses Ho: Step 2: Level of Significance t= Step 3: Critical Values Step 4: Test Statistics Step 5: Decision Step 6: Conclusion For item 34-35, solve for the following 34. A social worker reports that 30% of the workers in a factory are below 15 years old. A 120 employees surveyed. 38 said they were below 15 years old. Using a-0.05, interpret the p-value. Step 1: State the hypotheses He: Step 2: Level of Significance Step 3: Critical Values Step 4: Test Statistics Z = Step 5: Decision Step 6: Conclusion 35. Globally the long-term proportion of newborns who are male is 51%. A researcher believes that the proportion of boys at birth changes under severe economic changes. To test this belief randomly selected birth records of 5,000 babies born during a period of economic recession were examined. It was found in the sample that 53% of the newborns were boys. Determine whether there is sufficient evidence, at the 10% level of Significance, to support this researcher's belief. Step 1: State the hypothese Ha: Step 2: Level of Significance Za/2 = Step 3: Critical Values Step 4: Test Statistics Z = Step 5: Decision Step 6:Conclusion


