 need steps on how to do this in excel please ASAP
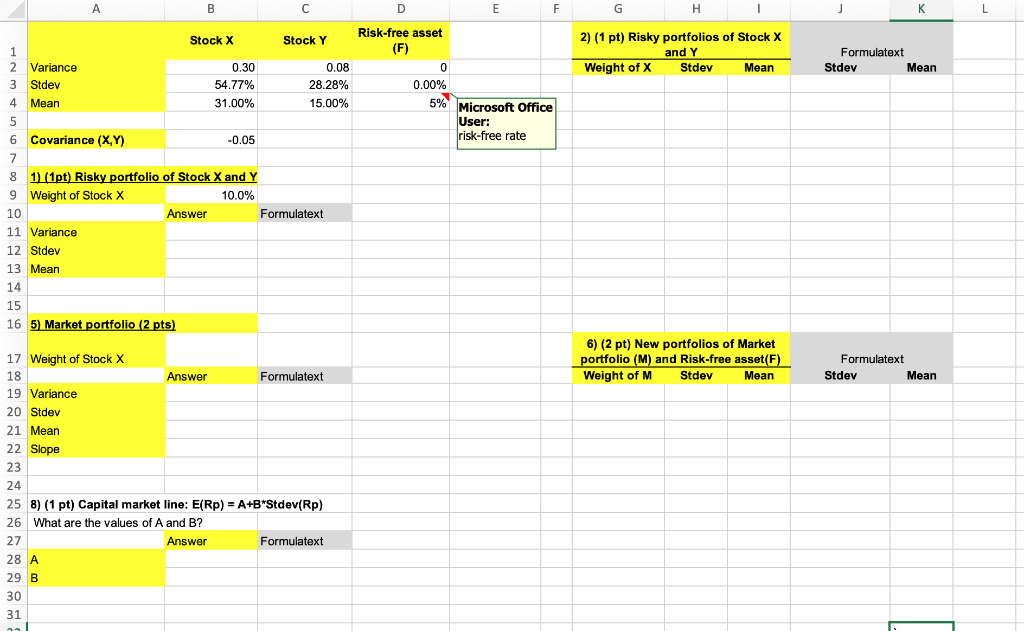
4. (9 points) Assume that there are only two stocks (Stock X and Y) and one risk-free asset in the market. 1) (1 point) Compute the summary statistics of the portfolio of 10% in Stock X and 90% in Stock Y. 2) (1 point) Complete a table of (risky) portfolios of Stock X and Y using the Data Table function. The portfolio weight of X varies from 0 (50%) to 1 (=100%) (increases by 0.1(10%)) 3) (0.5 point) Draw a graph of the risky portfolios using the table from 2). X-values: standard deviation, stdev(Rp) Y-values: mean (or expected return), E(Rp) . 4) (0.5 point) Is the portfolio of 10% in Stock X and 90% in Stock Y optimal? Explain why using the table or the graph above. Hint: See if this portfolio is above the min. variance portfolio in the graph. (in other words, see if the portfolio is on the efficient frontier) O 5) (2 points) Find the market portfolio(M) using the Solver function. Provide the portfolio weight of Stock X, mean and standard deviation of the market portfolio (M). Hint: Find the portfolio weight of Stock X to maximize the slope of the tangent line connecting the risk-free asset (F) with the graph from c). Slope = (mean of the market portfolio risk-free rate) stdev of the market portfolio I 6) (2 points) Complete the new table of new portfolios, which are a mix of the market portfolio (M) and risk-free asset (F). The portfolio weight of the market portfolio M varies from 0 (50%) to 1 (=100%) (increases by 0.1(10%) 7) (1 point) Add a graph of the new portfolios in the table from 6) into the existing graph from 3). Change the name of the series to Capital Market Line (CML) Add two data points: Market Portfolio (M) and risk-free asset (F) . . 8) (1 point) Provide the equation of the capital market line (CML): E(Rp) = A+B*Stdev(Rp). What are the values of A and B? E(Rp): mean or expected return of the portfolio Stdev (Rp): standard deviation of the portfolio A B C E F F. H K L 2) (1 pt) Risky portfolios of Stock X and Y Weight of X Stdev Mean Formulatext Stdev Mean Risk-free asset (F) 0 0.00% 5% Microsoft Office User: risk-free rate Stock X Stock Y 1 2 Variance 0.30 0.08 3 Stdev 54.77% 28.28% 4 Mean 31.00% 15.00% 5 6 Covariance (X,Y) -0.05 7 8 1) (1pt) Risky portfolio of Stock X and Y 9 Weight of Stock X 10.0% 10 Answer Formulatext 11 Variance 12 Stdev 13 Mean 14 15 16 5) Market portfolio (2 pts) 6) (2 pt) New portfolios of Market portfolio (M) and Risk-free asset(F) Weight of M Stdev Mean Formulatext Stdev Mean 17 Weight of Stock X 18 Answer Formulatext 19 Variance 20 Stdev 21 Mean 22 Slope 23 24 25 8) (1 pt) Capital market line: E(Rp) = A+B*Stdev(Rp) 26 What are the values of A and B? 27 Answer Formulatext 28 A 29 B 30 31 4. (9 points) Assume that there are only two stocks (Stock X and Y) and one risk-free asset in the market. 1) (1 point) Compute the summary statistics of the portfolio of 10% in Stock X and 90% in Stock Y. 2) (1 point) Complete a table of (risky) portfolios of Stock X and Y using the Data Table function. The portfolio weight of X varies from 0 (50%) to 1 (=100%) (increases by 0.1(10%)) 3) (0.5 point) Draw a graph of the risky portfolios using the table from 2). X-values: standard deviation, stdev(Rp) Y-values: mean (or expected return), E(Rp) . 4) (0.5 point) Is the portfolio of 10% in Stock X and 90% in Stock Y optimal? Explain why using the table or the graph above. Hint: See if this portfolio is above the min. variance portfolio in the graph. (in other words, see if the portfolio is on the efficient frontier) O 5) (2 points) Find the market portfolio(M) using the Solver function. Provide the portfolio weight of Stock X, mean and standard deviation of the market portfolio (M). Hint: Find the portfolio weight of Stock X to maximize the slope of the tangent line connecting the risk-free asset (F) with the graph from c). Slope = (mean of the market portfolio risk-free rate) stdev of the market portfolio I 6) (2 points) Complete the new table of new portfolios, which are a mix of the market portfolio (M) and risk-free asset (F). The portfolio weight of the market portfolio M varies from 0 (50%) to 1 (=100%) (increases by 0.1(10%) 7) (1 point) Add a graph of the new portfolios in the table from 6) into the existing graph from 3). Change the name of the series to Capital Market Line (CML) Add two data points: Market Portfolio (M) and risk-free asset (F) . . 8) (1 point) Provide the equation of the capital market line (CML): E(Rp) = A+B*Stdev(Rp). What are the values of A and B? E(Rp): mean or expected return of the portfolio Stdev (Rp): standard deviation of the portfolio A B C E F F. H K L 2) (1 pt) Risky portfolios of Stock X and Y Weight of X Stdev Mean Formulatext Stdev Mean Risk-free asset (F) 0 0.00% 5% Microsoft Office User: risk-free rate Stock X Stock Y 1 2 Variance 0.30 0.08 3 Stdev 54.77% 28.28% 4 Mean 31.00% 15.00% 5 6 Covariance (X,Y) -0.05 7 8 1) (1pt) Risky portfolio of Stock X and Y 9 Weight of Stock X 10.0% 10 Answer Formulatext 11 Variance 12 Stdev 13 Mean 14 15 16 5) Market portfolio (2 pts) 6) (2 pt) New portfolios of Market portfolio (M) and Risk-free asset(F) Weight of M Stdev Mean Formulatext Stdev Mean 17 Weight of Stock X 18 Answer Formulatext 19 Variance 20 Stdev 21 Mean 22 Slope 23 24 25 8) (1 pt) Capital market line: E(Rp) = A+B*Stdev(Rp) 26 What are the values of A and B? 27 Answer Formulatext 28 A 29 B 30 31