

Answered step by step
Verified Expert Solution
Question
1 Approved Answer
Need the correct Matlab code for this question ASAP!!! Thank you 3. (50 points) You are given a function f(x) = sin(x) on the interval
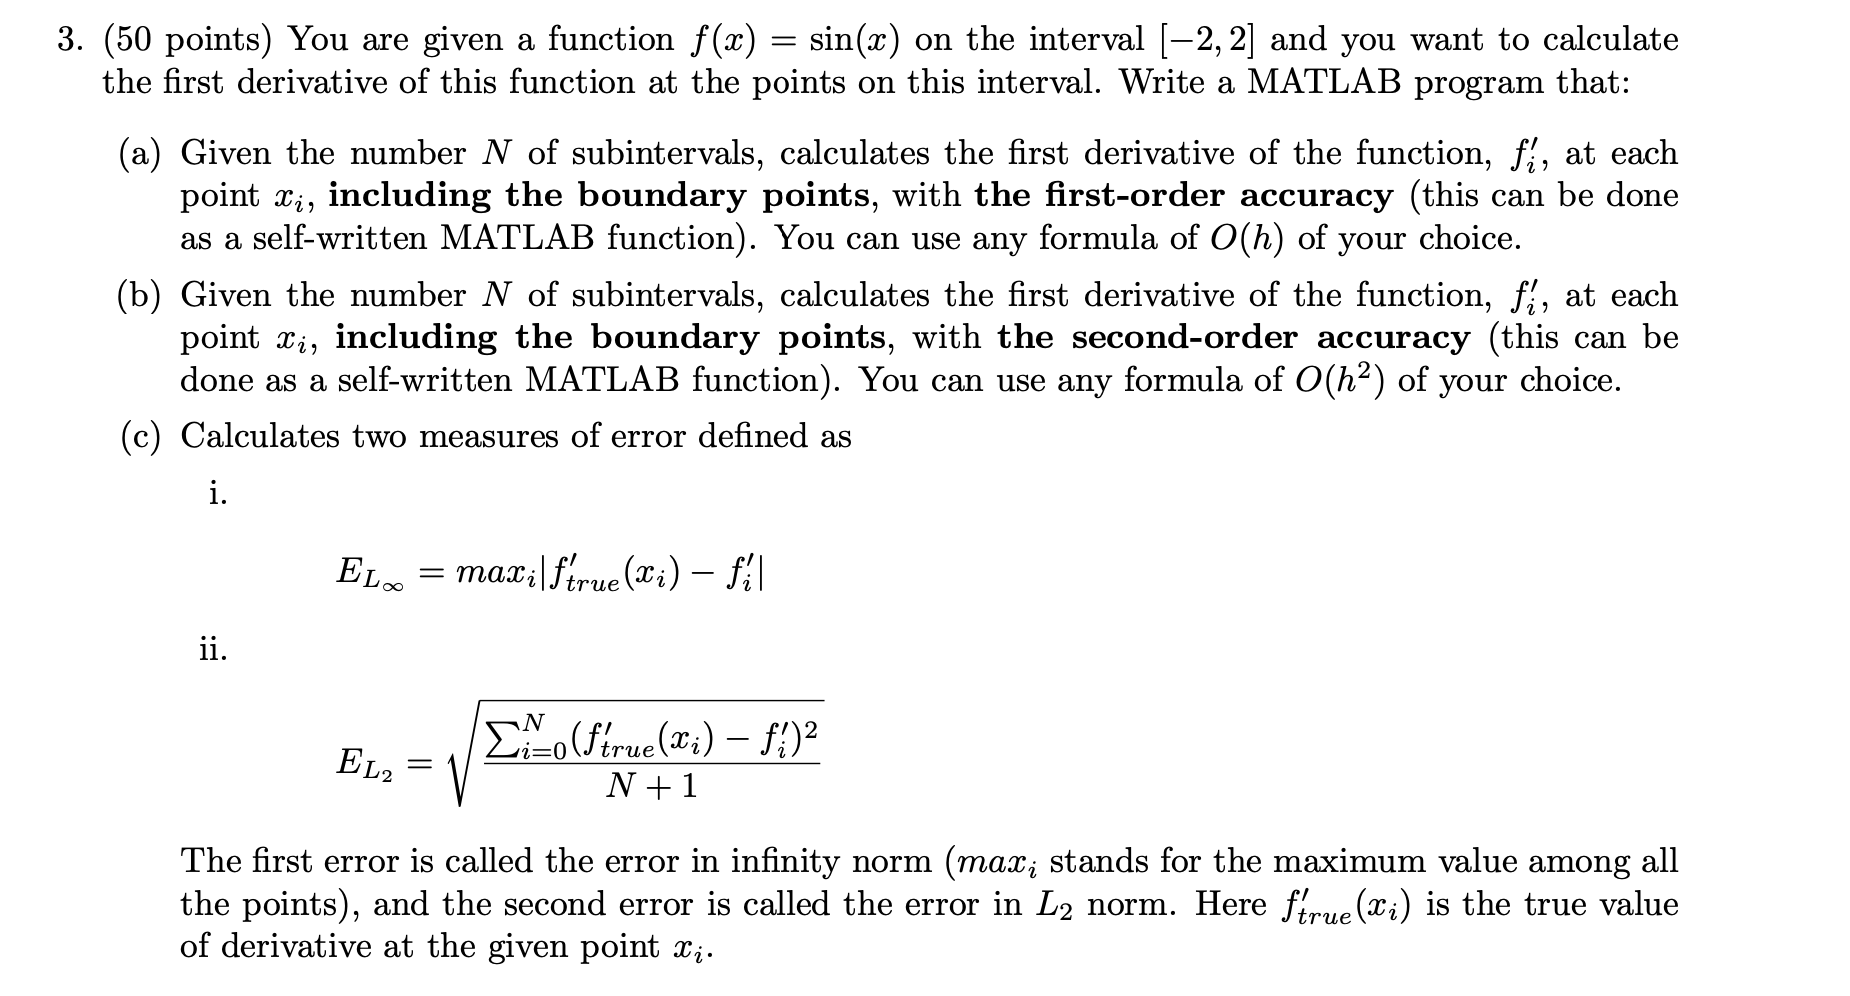
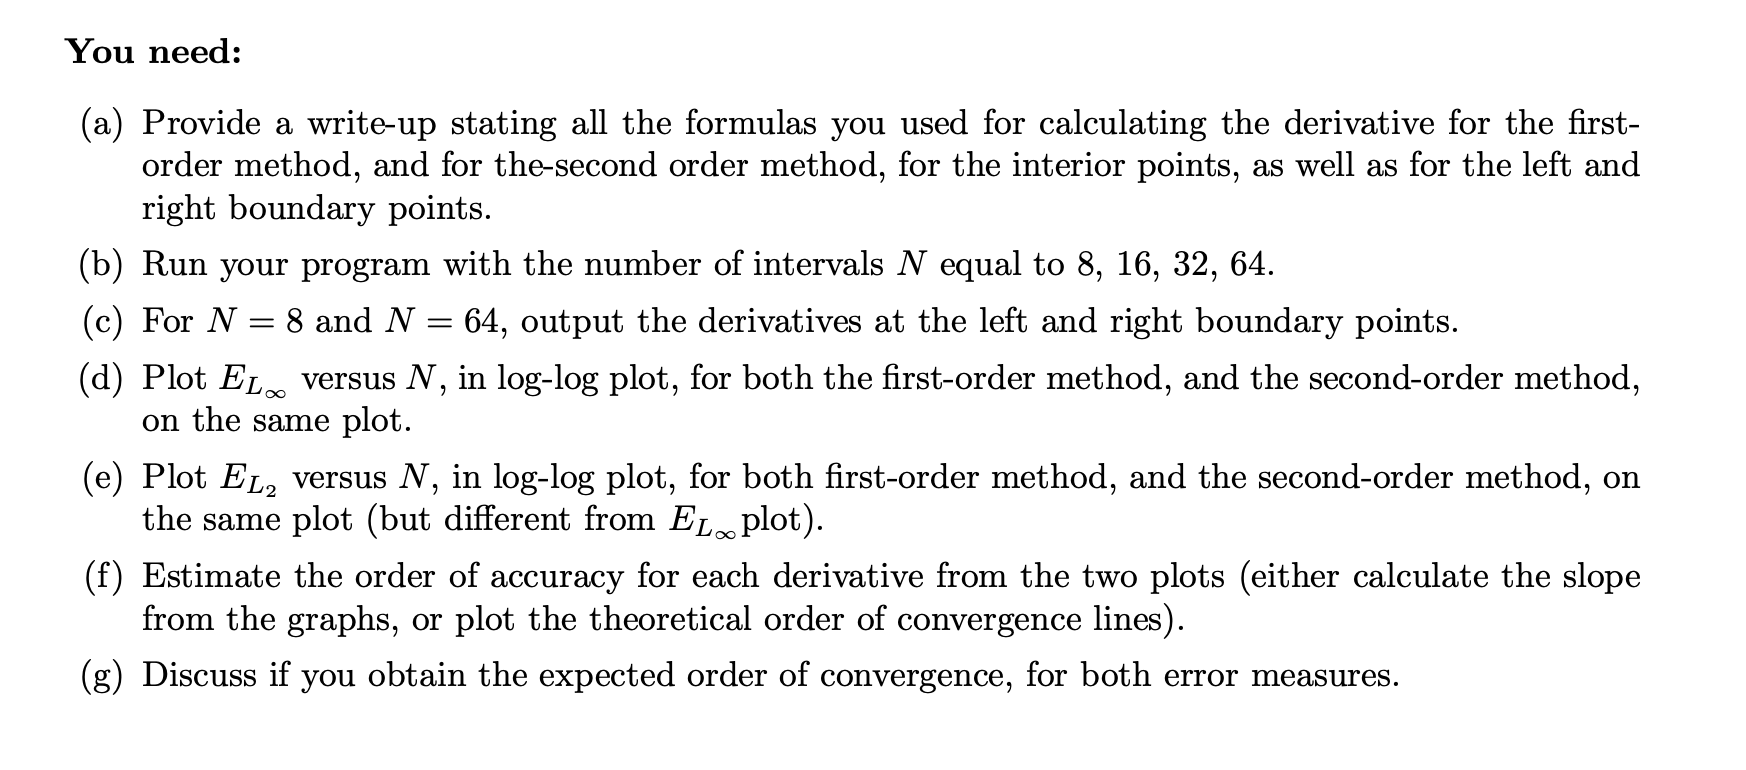 Need the correct Matlab code for this question ASAP!!! Thank you
Step by Step Solution
There are 3 Steps involved in it
Step: 1

Get Instant Access to Expert-Tailored Solutions
See step-by-step solutions with expert insights and AI powered tools for academic success
Step: 2

Step: 3
Ace Your Homework with AI
Get the answers you need in no time with our AI-driven, step-by-step assistance
Get Started
Scientific And Statistical Database Management 2 International Conference Ssdbm 2012 Chania Crete Greece June 2012 Proceedings Lncs 7338
Authors: Anastasia Ailamaki ,Shawn Bowers
2012 Edition
3642312349, 978-3642312342