

Question
Need this in Python: The National Weather Service collects much data about the weather, including average daily temperatures. I have provided a temperature file for
Need this in Python:
The National Weather Service collects much data about the weather, including average daily temperatures. I have provided a temperature file for Houston that contains Houston's average daily temperatures from 1995 until 2016. Write a program that reads in all the temperature data from TXHOUSTO.txt. Do not use any built-in functions such as max and min. Even if you have read ahead, do not use lists. Then I would like you to find the following and write it out to a file:
1) The date that had the lowest average daily temperature.
2) The date that had the highest average daily temperature.
3) The date and daily average temperature on July 4, 2000.
If the daily average temperature is -99, skip that record. A value of -99 means that the temperature was not recorded on that day. Your output file should be named "temperature-answers.txt". You should upload both your program file and your output file to blackboard. Hint: After you read in a line of temperature data, you will need to use the split() method to get the values out of the line. You can find more here: https://docs.python.org/3.4/library/stdtypes.html#str.split You should also refer back to the functions chapter and look at examples of when multiple values are returned from a function and are then assigned into multiple variables. For example, you can do something like this --> x, y = 1, 2 After this statement x = 1 and y = 2
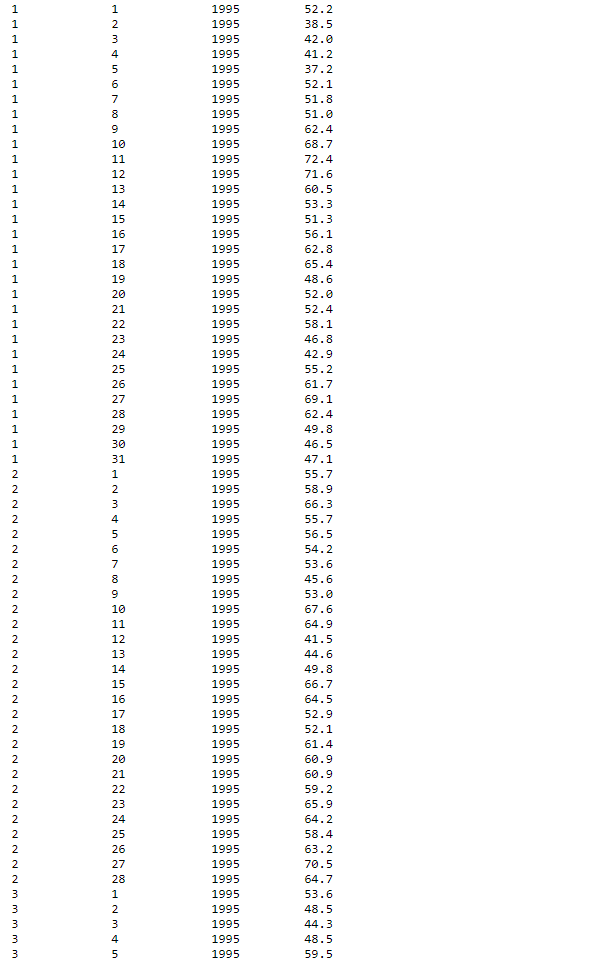
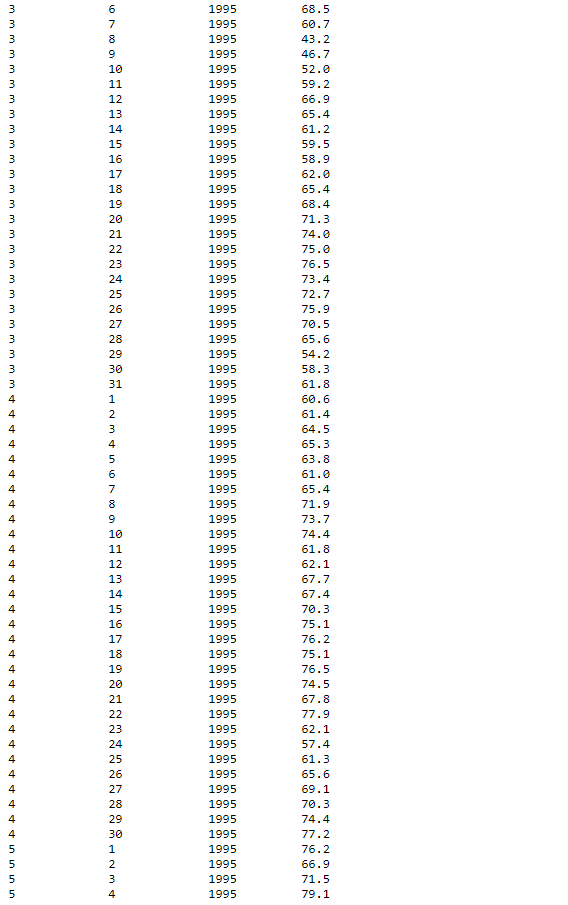
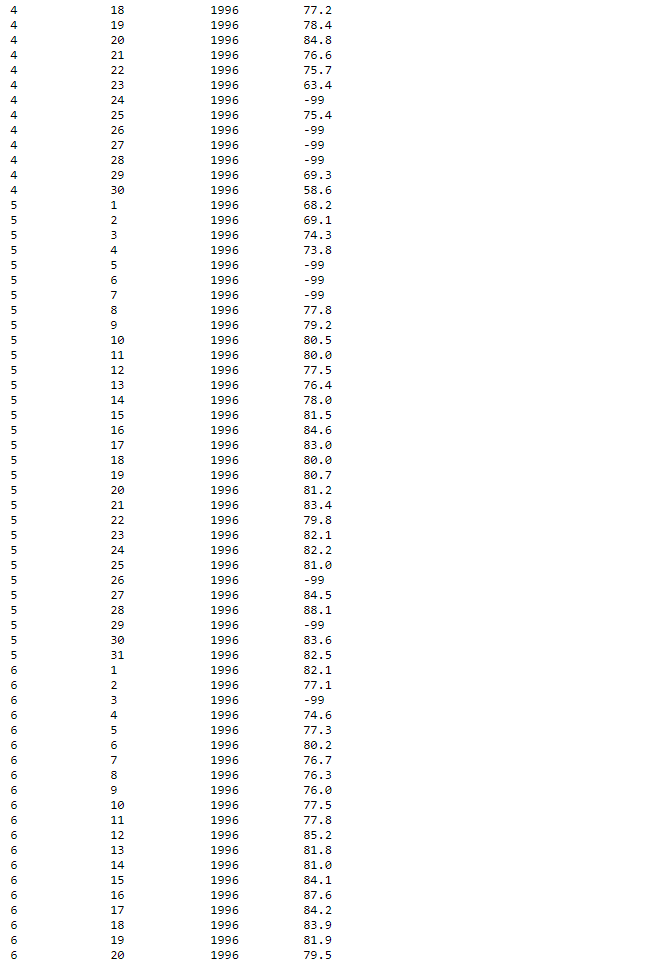
Screenshots from file TXHOUSTO.txt:
Step by Step Solution
There are 3 Steps involved in it
Step: 1

Get Instant Access to Expert-Tailored Solutions
See step-by-step solutions with expert insights and AI powered tools for academic success
Step: 2

Step: 3
Ace Your Homework with AI
Get the answers you need in no time with our AI-driven, step-by-step assistance
Get Started
Visual C# And Databases
Authors: Philip Conrod, Lou Tylee
16th Edition
1951077083, 978-1951077082