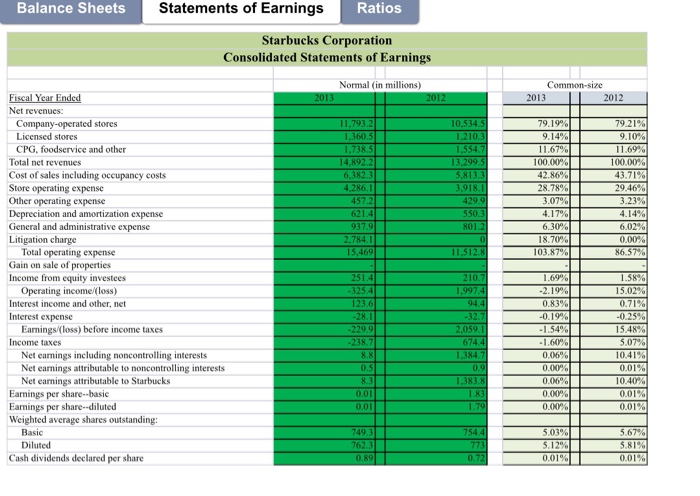
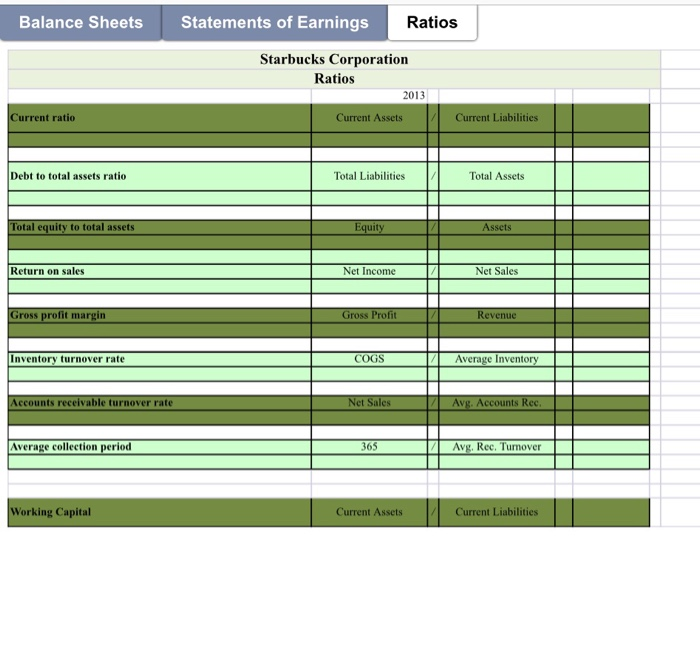
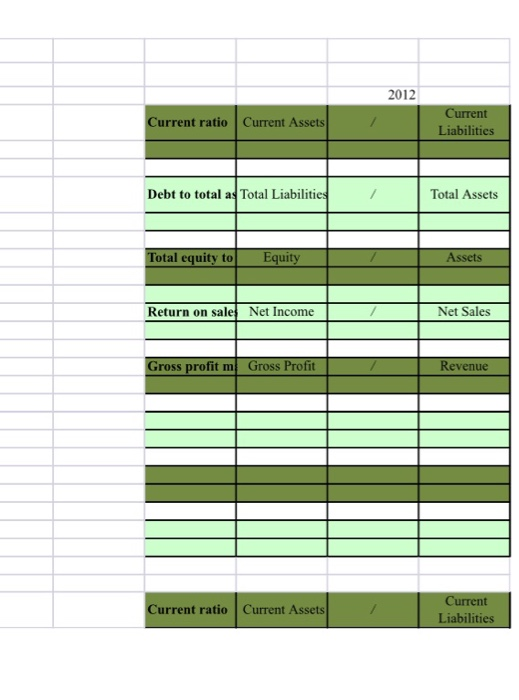
need to do the ratios in the charts.
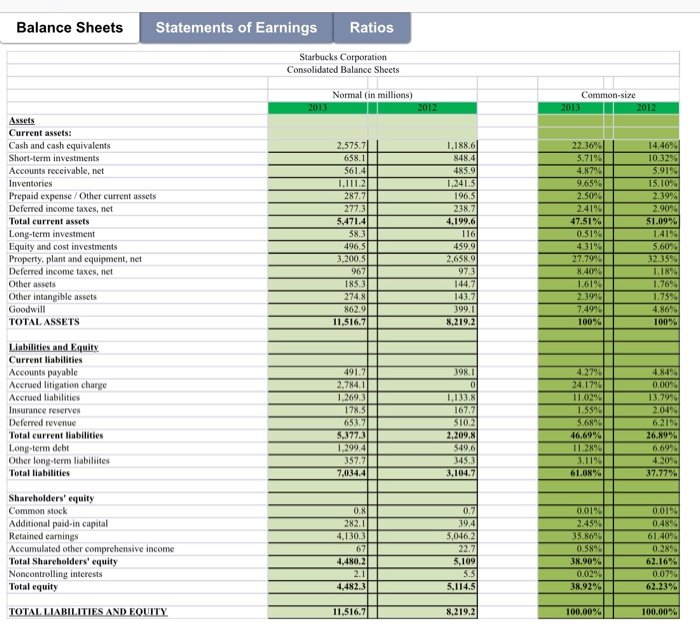
Statements of Earnings Balance Sheets Ratios Starbucks Corporation Consolidated Balance Sheets Normal (in millions) Common-size 2012 2013 2012 2013 Assets Current assets: 1,188.6 14.46% 10.32% 5.91% 15.10% Cash and cash equivalents Short-term investments Accounts receivable, net 2,575.7 22.36% 658.1 5.71% 848.4 561.4 485.S 4.87% 1,111.2 9.65% Inventories 1.241.5 Prepaid expense /Other current assets 287.7 196.5 238.7 2.50% 2.39 % 2,90% 51.09% 1.41% 2.41% 277.3 5,471.4 58.3 Deferred income taxes, net Total current assets 4,199.6 47.51% 0.51% 4.31% Long-term investment Equity and cost investments Property, plant and equipment, net Deferred income taxes, net 116 496.5 459.9 5.60% 32.35% L.18% 1.76% 1.75% 3,200.5 2,658.9 97.3 27.79% 967 8.40% Other assets 185.3 144.7 1.61% 274.8 2.39% Other intangible assets Goodwill 143.7 862.9 399.1 7.49% 4.86% 11,516.7 8,219.2 TOTAL ASSETS 100% 100% Liabilities and Equity Current liabilities Accounts payable 4.27% 24.17% 11.02% 491.7 398,1 4.84% 0.00% Accrued litigation charge Accrued liabilities 2,784.1 1.269.3 1.133.8 13.79% 2.04% 6.21% Insurance reserves Deferred revenue 178.5 653.7 5,377.3 167.7 1.55% 510.2 2,209.8 5.68% 26.89% Total current liabilities 46.69% Long-term debt Other long-term liabilites 11.28 % 1.299.4 549.6 6.69% 357.7 4.20% 37.77% 345.3 3.11% Total liabilities 7,034.4 3,104.7 61.08% Shareholders' equity 0.01% 0.48% Common stock 0.8. 0.2 0.01% Additional paid-in capital Retained carnings 39.4 2.45% 282.1 4,130.3 5,046.2 35.86% 61.40% Accumulated other comprehensive income Total Shareholders' equity 67 22.7 0.58% 0.28% 4,480.2 5.109 38.90% 62.16% 5.5 5.114.5 Noncontrolling interests 2.1 0.02% 0.07% 4,482.3 38.92% 62.23% Total equity TOTAL LIABILITIES AND EQUITY 11.516.7 100.00% 100.00% 8,219.2 Statements of Earnings Balance Sheets Ratios Starbucks Corporation Consolidated Statements of Earnings Normal (in millions) Common-size Fiscal Year Ended 2013 2012 2013 2012 Net revenues: 79.21% 9,10% 11.69% 11,793.2 1,360.5 10.534 5 79.19% Company-operated stores 1,210.3 1,554.7 13.299.5 5.813.3 3,918.1 Licensed stores 9,14% 11.67% CPG, foodservice and other 1,738.5 Total net revenues 14,892.2 100.00% 100.00% 43.71% 29.46% 3.23% Cost of sales including occupancy costs Store operating expense Other operating expense Depreciation and amortization expense General and administrative expense Litigation charge Total operating expense Gain on sale of properties Income from equity investees Operating income/(loss) Interest income and other, net 6,382.3 4,286.1 457.2 42.86% 28.78% 3.07% 4.17% 429.9 621.4 550.3 4.14% 937 9 801.2 6.02 % 6.30% 2,784.1 15,469 18.70% 0.00% 11,512.8 103.87 % 86.57% 1,69% 251.4 -325.4 123.6 -28.1 210.7 1,997.4 1.58% 15.02% 0.71% -0.25 % 15.48 % 5.07% 10.41% -2.19 % 0.83% 94.4 -32.7 2,059.11 Interest expense Earnings/(loss) before income taxes -0.19% -229.9 1.54% -238.7 674.4 1,384.7 -1.60% Income taxes Net earnings including noncontrolling interests Net earnings attributable to noncontrolling interests Net earnings attributable to Starbucks 0.06% 0.00% 8.8 0.9 0.5 0.01% 8.3 1,383.8 1.83 0.06% 10.40% Eamings per share--basic Eamings per share--diluted Weighted average shares outstanding: 0.01% 0,01% 0.01 0.00% 1.79 0.01 0.00% 754 4 773 0.72 Basic 749.3 5.03% 5.67% 5.12% 0.01% 5.81% 0.01% Diluted 762.3 0.89 Cash dividends declared per share Balance Sheets Statements of Earnings Ratios Starbucks Corporation Ratios 2013 Current ratio Current Assets Current Liabilities Debt to total assets ratio Total Liabilities Total Assets Equity Total equity Assets to total assets Net Sales Return on sales Net Income Gross profit margin Gross Profit Revenue Average Inventory COGS Inventory turnover rate Accounts receivable turnover Avg. Accounts Rec. Net Sales rate Average collection period Avg. Rec. Turnover 365 Working Capital Current Assets Current Liabilities 2012 Current Current Assets Current ratio Liabilities Total Liabilities Total Assets Debt to total as Total equity to Assets Equity Net Sales Return on sales Net Income Gross profit Gross Profit Revenue mi Current Current ratio Current Assets Liabilities