Need to double check my answer thanks
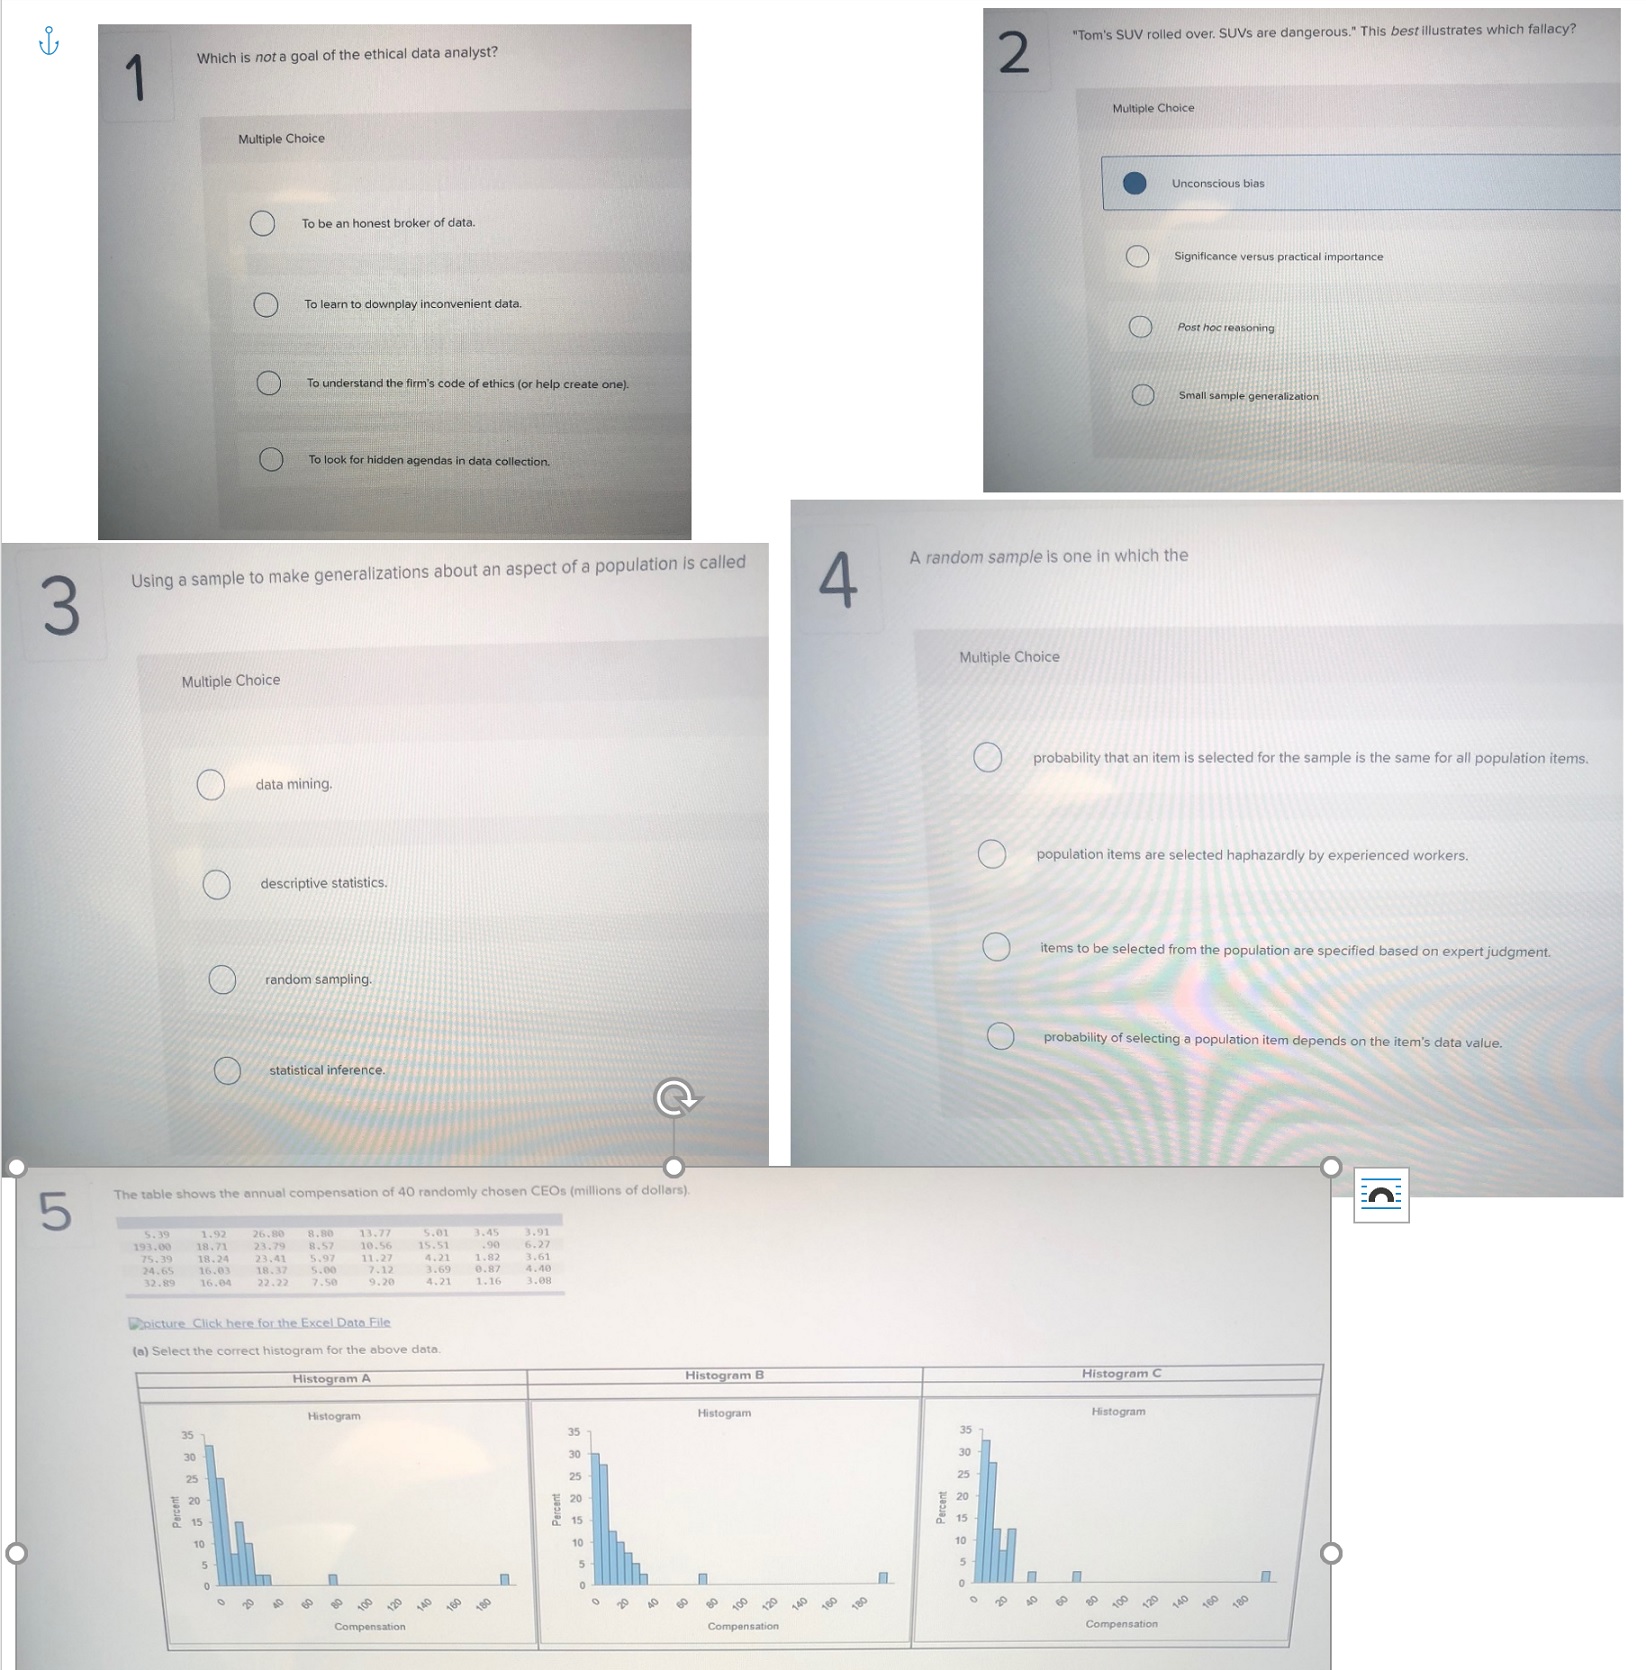
Which is not a goal of the ethical data analyst? 2 'Tom's SUV rolled over. SUVs are dangerous." This best illustrates which fallacy? Multiple Choice Multiple Choice Unconscious bias O To be an honest broker of data. Significance versus practical importance To learn to downplay inconvenient data. Post hoc reasoning O To understand the firm's code of ethics (or help create one). Small sample generalization O To look for hidden agendas in data collection. Using a sample to make generalizations about an aspect of a population is called A random sample is one in which the 3 4 Multiple Choice Multiple Choice O probability that an item is selected for the sample is the same for all population items. data mining. O population items are selected haphazardly by experienced workers. O descriptive statistics. O items to be selected from the population are specified based on expert judgment. random sampling. O probability of selecting a population item depends on the item's data value. O statistical inference O 5 The table shows the annual compensation of 40 randomly chosen CEOs (millions of dollars). in: .picture Click here for the Excel Data File (a) Select the cor stogram for the above data. Histogram A Histogram B Histogram C Histogram Histogram Histogram 35 25 Percent Percent O Compensation7 Floor Space (sq. ft.) Weekly Sales (dollars) 6, 060 16, 380 5, 230 14, 400 4, 280 13, 820 5,580 18, 230 5,670 14, 200 5,020 12, 800 5,410 15, 840 4,990 16, 610 4, 220 13, 610 4, 160 10, 050 4,870 15, 320 5, 470 13, 270 Click here for the Excel Data File (a) Using the table above, select the most appropriate scatter plot from the given choices. Scatter Plot A Scatter Plot B Scatter Plot C Floor Space and Weekly Sales Floor Space and Weekly Sales Floor Space and Weekly Sales 20,000 20,000 20,000 16,000 18.00 18,000 14,000 12,000 14,000 16,000 12,000 WEEKLY SALES 10,000 12,000 8:000 10,000 10,000 6:000 8.000 8.000 4,000 2,000 4,000 4,000 2,000 2,000 0 0 1,000 2,000 3,000 4,000 5,000 6,000 7,000 1,000 2,000 3,000 4,000 5,000 6,000 7,000 0 1,000 2,000 3,000 4,000 5,000 6,000 7,000 FLOOR SPACE FLOOR SPACE FLOOR SPACE O Scatter Plot A O Scatter Plot B O Scatter Plot C (b) Define the relationship between X and Y. (You may select more than one answer. Click the box with a check mark for the correct answer and double click to empty the box for the wrong answer.) ? Negative 2 Strong ? Positive ? Moderate ? Nonlinear ? Linear8 Which data would be suitable for a pie chart? Multiple Choice O Whirlpool Corporation's sales revenue for the last five years Oxnard University student category (undergraduate, masters, doctoral) O Average SAT scores for entering freshmen at 10 major U.S. universities U.S. toy imports from China over the past decadeConsider the following graph. 9 Where Do Advertising Dollars Go? Other 16% Print 32% Direct Mail 20% Radio TV 8% 24% Click here for the Excel Data File (a) What kind of display is this? Standard pie chart O Line chart O Column chart (b-1) Identify its strengths, using the tips and checklists shown in this chapter. O Labels on Y axes O Use of gridlines O Source identified (b-2) Identify its weaknesses, using the tips and checklists shown in this chapter. Non-zero origin O Distracting pictures O Dramatic title O OtherAn executive's telephone log showed the lengths of 60 calls initiated during the last week of July. 10 Le 20 CONVINWH UHOHNW ADNWN HANVNU WHNHOP Click here for the Excel Data File (b) Find the mean, median, and mode. (Round your answers to 2 decimal places.) Descriptive Data Statistics count Mean Median Mode (c) Do the measures of center agree? Yes O No (d) Are the data symmetric or skewed? If skewed, which direction? Yes, the data are skewed to the right. O No, the distribution is symmetric. O Yes, the data are skewed to the left.Consider the following sample data. 11 Sample A: 11, 19, 27 Sample B: 69, 77, 85 Sample C: 1, 040; 1, 048; 1, 056 (a) Find the mean and standard deviation for each sample. Sample A: Sample B: Sample C: Mean Sample Standard Deviation (b) What does this exercise show about the standard deviation? The idea is to illustrate that the standard deviation is not a function of the value of the mean. The idea is to illustrate that the standard deviation is a function of the value of the mean.The durations (minutes) of 26 electric power outages in the community of Sonando Heights over the past five years are shown below. 12 38 49 23 68 24 14 54 13 49 2 12 41 41 100 30 18 12 53 20 2 18 26 92 25 15 21 Click here for the Excel Data File (a) Find the mean, median, and mode. (Round your answers to 2 decimal places.) Descriptive Statistics Data Mear Median Mode (b) Are the mean and median about the same? (Click to select) the mean is (Click to select) the median. (c) Is the mode a good measure of center for this data set? O Yes O No (d) Is the distribution skewed? O No, the distribution is symmetric. Yes, the distribution is skewed left. O Yes, the distribution is skewed right.Scores on an accounting exam ranged from 48 to 96, with quartiles Q1= 65.00, Q2= 82.5, and Q3= 85.75. 13 (a) Select the correct box plot for the given data. BoxPlot A BoxPlot B BoxPlot C BoxPlot BoxPlot BoxPlot 60 70 80 90 100 40 50 60 70 80 90 100 40 50 60 70 80 90 100 40 50 O BoxPlot A BoxPlot B O BoxPlot C (b) Describe its shape (skewed left, symmetric, skewed right). The distribution is skewed right. The distribution is symmetric. The distribution is skewed left.Tire pressure monitoring systems (TPMS) warn the driver when the tire pressure of the vehicle is 27% below the target pressure. 18 Suppose the target tire pressure of a certain car is 32 psi (pounds per square inch.) (a) At what psi will the TPMS trigger a warning for this car? (Round your answer to 2 decimal place.) When the tire pressure is (Click to select) V psi. (b) Suppose tire pressure is a normally distributed random variable with a standard deviation equal to 3 psi. If the car's average tire pressure is on target, what is the probability that the TPMS will trigger a warning? (Round your answer to 4 decimal places.) Probability (c) The manufacturer's recommended correct inflation range is 30 psi to 34 psi. Assume the tires' average psi is on target. If a tire on the car is inspected at random, what is the probability that the tire's inflation is within the recommended range? (Round your intermediate calculations and final answer to 4 decimal places.) ProbabilityTimes for a surgical procedure are normally distributed. There are two methods. Method A has a mean of 28 minutes and a standard 19 deviation of 2 minutes, while method B has a mean of 32 minutes and a standard deviation of 1.0 minutes. (a) Which procedure is preferred if the procedure must be completed within 30 minutes? O Method A O Method B O Either Method (b) Which procedure is preferred if the procedure must be completed within 34.0 minutes? O Either Method O Method A O Method B (c) Which procedure is preferred if the procedure must be completed within 31 minutes? O Method B O Either Method O Method A