

Question
Need to find industry data: Peripherals&office Equipment and compare with a company. Details are in the photo. There are no data on industry, as I
Need to find industry data: Peripherals&office Equipment and compare with a company. Details are in the photo. There are no data on industry, as I can't find details.
So 2 problems to solve:
1. Find right data from Industry statistics
2. Comment on comparison of the Company data with the Industry data.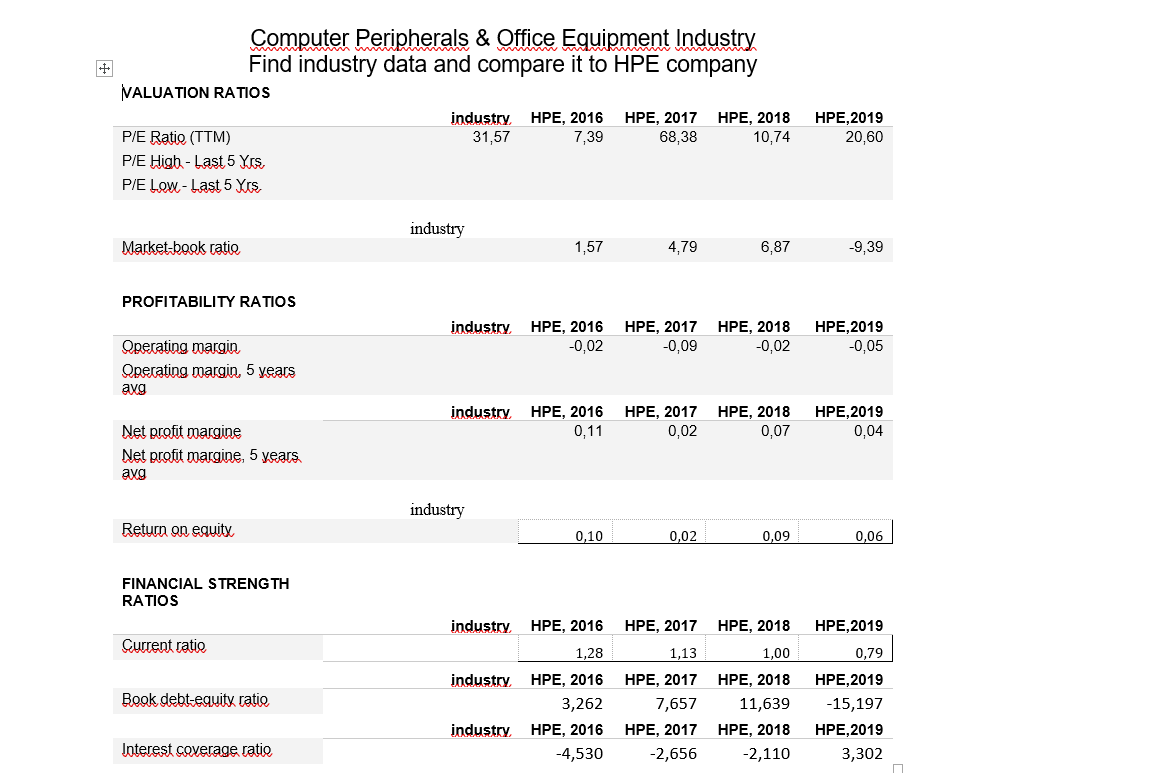
have already closed this case.
Computer Peripherals & Office Equipment Industry Find industry data and compare it to HPE company VALUATION RATIOS industry HPE, 2016 HPE, 2017 HPE, 2018 P/E Ratio (TTM) 31,57 7,39 68,38 10,74 P/E High - Last 5 Yrs, P/E LOWL- Last 5 Yes HPE 2019 20,60 industry Market-book ratio 1,57 4,79 6,87 -9,39 PROFITABILITY RATIOS industry HPE, 2016 -0,02 HPE, 2017 -0,09 HPE, 2018 -0,02 HPE,2019 -0,05 Operating margin Operating margin, 5 years avg industry HPE, 2016 0,11 HPE, 2017 0,02 HPE, 2018 0,07 HPE 2019 0,04 Net profit margine Net profit margine, 5 years. avg industry Return on equity 0,10 0,02 0,09 0,06 FINANCIAL STRENGTH RATIOS industry HPE, 2016 HPE, 2017 HPE, 2018 HPE 2019 Current ratio 1,28 1,13 1,00 industry Book debt-equity ratio HPE, 2016 3,262 HPE, 2016 -4,530 HPE, 2017 7,657 HPE, 2017 -2,656 HPE, 2018 11,639 HPE, 2018 -2,110 0,79 HPE,2019 -15,197 HPE, 2019 3,302 industry Interest coverage ratio Computer Peripherals & Office Equipment Industry Find industry data and compare it to HPE company VALUATION RATIOS industry HPE, 2016 HPE, 2017 HPE, 2018 P/E Ratio (TTM) 31,57 7,39 68,38 10,74 P/E High - Last 5 Yrs, P/E LOWL- Last 5 Yes HPE 2019 20,60 industry Market-book ratio 1,57 4,79 6,87 -9,39 PROFITABILITY RATIOS industry HPE, 2016 -0,02 HPE, 2017 -0,09 HPE, 2018 -0,02 HPE,2019 -0,05 Operating margin Operating margin, 5 years avg industry HPE, 2016 0,11 HPE, 2017 0,02 HPE, 2018 0,07 HPE 2019 0,04 Net profit margine Net profit margine, 5 years. avg industry Return on equity 0,10 0,02 0,09 0,06 FINANCIAL STRENGTH RATIOS industry HPE, 2016 HPE, 2017 HPE, 2018 HPE 2019 Current ratio 1,28 1,13 1,00 industry Book debt-equity ratio HPE, 2016 3,262 HPE, 2016 -4,530 HPE, 2017 7,657 HPE, 2017 -2,656 HPE, 2018 11,639 HPE, 2018 -2,110 0,79 HPE,2019 -15,197 HPE, 2019 3,302 industry Interest coverage ratioStep by Step Solution
There are 3 Steps involved in it
Step: 1

Get Instant Access to Expert-Tailored Solutions
See step-by-step solutions with expert insights and AI powered tools for academic success
Step: 2

Step: 3
Ace Your Homework with AI
Get the answers you need in no time with our AI-driven, step-by-step assistance
Get Started
Eco Management And Audit Scheme
Authors: Gerardus Blokdyk
3rd Edition
0655169709, 978-0655169703