

Answered step by step
Verified Expert Solution
Question
1 Approved Answer
Need to find projected sales and profit FY2022 of vendor A product headphones P&L Case: Example Profits & Losses (P&L) Statement Sen A P&L statement
Need to find projected sales and profit FY2022 of vendor A product headphones
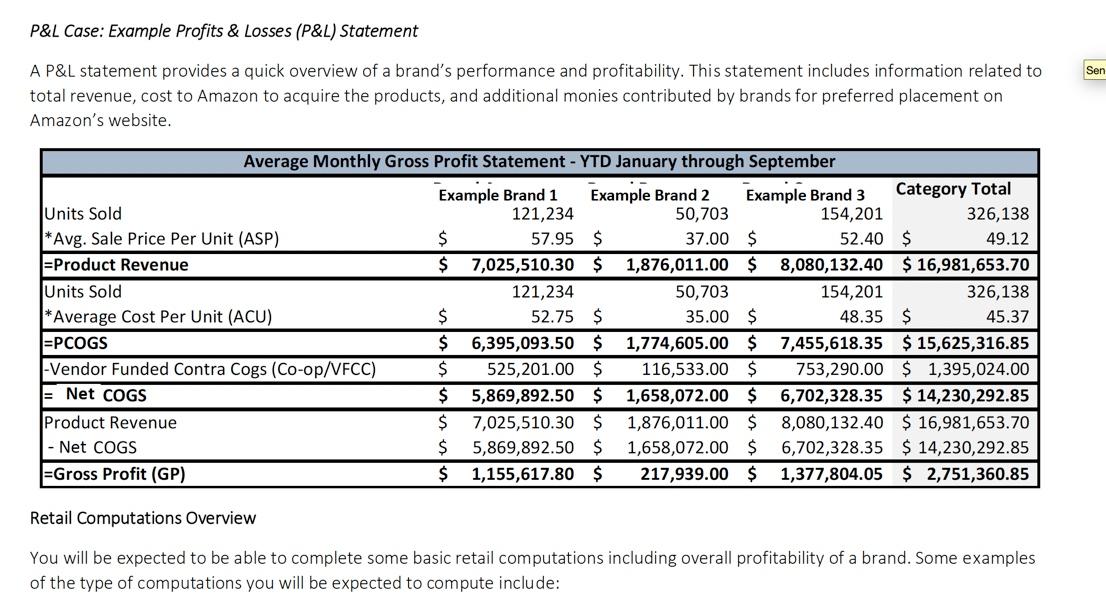
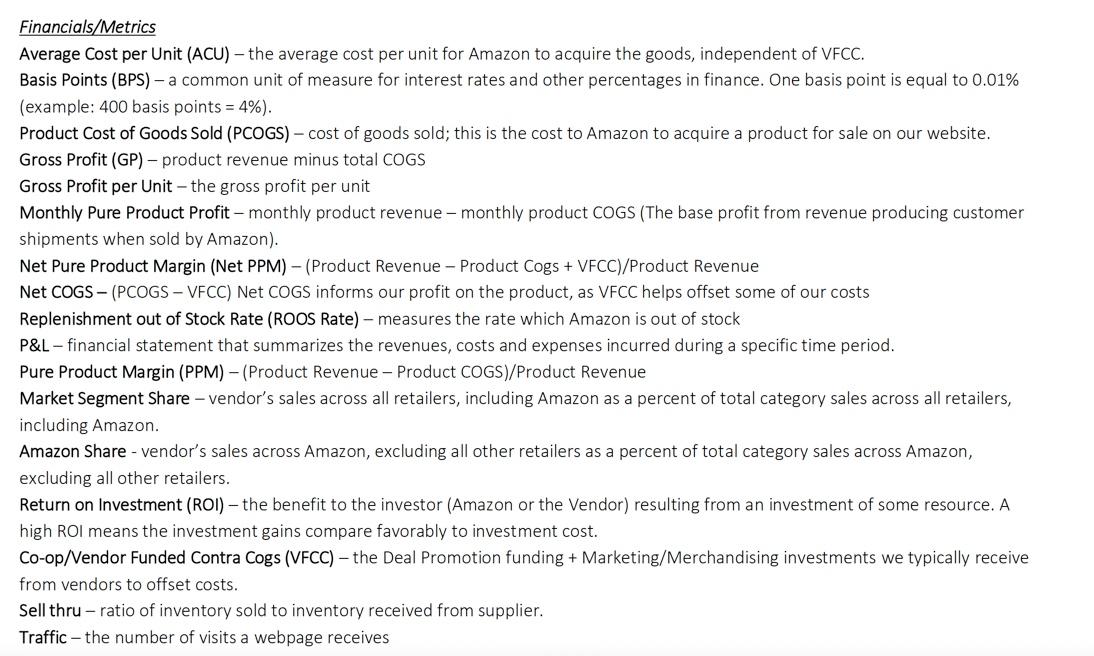
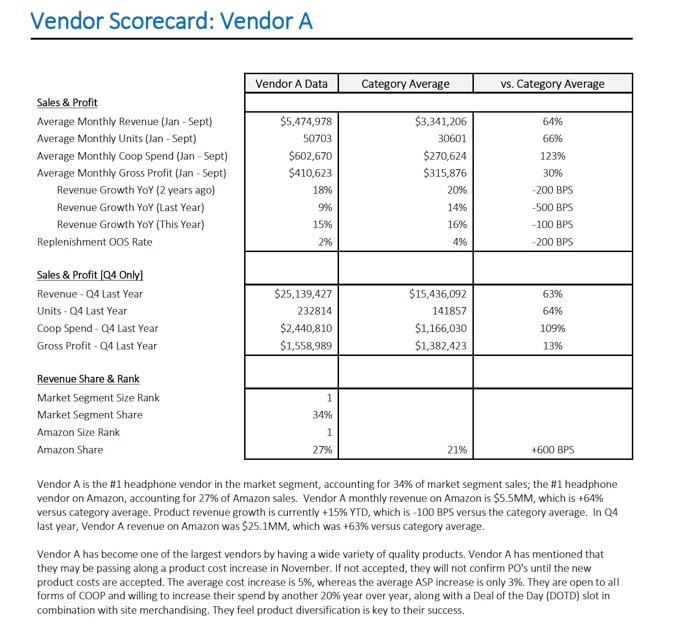
P&L Case: Example Profits & Losses (P&L) Statement Sen A P&L statement provides a quick overview of a brand's performance and profitability. This statement includes information related to total revenue, cost to Amazon to acquire the products, and additional monies contributed by brands for preferred placement on Amazon's website. Average Monthly Gross Profit Statement - YTD January through September Example Brand 1 Example Brand 2 Example Brand 3 Category Total Units Sold 121,234 50,703 154,201 326,138 *Avg. Sale Price Per Unit (ASP) $ 57.95 $ 37.00 $ 52.40 $ 49.12 =Product Revenue $ 7,025,510.30 $ 1,876,011.00 $ 8,080,132.40 $ 16,981,653.70 Units Sold 121,234 50,703 154,201 326,138 *Average Cost Per Unit (ACU) $ 52.75 $ 35.00 $ 48.35 $ 45.37 =PCOGS $ 6,395,093.50 $ 1,774,605.00 $ 7,455,618.35 $ 15,625,316.85 -Vendor Funded Contra Cogs (Co-op/VFCC) $ 525,201.00 $ 116,533.00 $ 753,290.00 $ 1,395,024.00 = Net COGS $ 5,869,892.50 $ 1,658,072.00 $ 6,702,328.35 $ 14,230,292.85 Product Revenue $ 7,025,510.30 $ 1,876,011.00 $ 8,080,132.40 $ 16,981,653.70 - Net COGS $ 5,869,892.50 $ 1,658,072.00 $ 6,702,328.35 $ 14,230,292.85 =Gross Profit (GP) $ 1,155,617.80 $ 217,939.00 $ 1,377,804.05 $ 2,751,360.85 Retail Computations Overview You will be expected to be able to complete some basic retail computations including overall profitability of a brand. Some examples of the type of computations you will be expected to compute include: Financials/Metrics Average Cost per Unit (ACU) - the average cost per unit for Amazon to acquire the goods, independent of VFCC. Basis Points (BPS) - a common unit of measure for interest rates and other percentages in finance. One basis point is equal to 0.01% (example: 400 basis points = 4%). Product Cost of Goods Sold (PCOGS) - cost of goods sold; this is the cost to Amazon to acquire a product for sale on our website. Gross Profit (GP) - product revenue minus total COGS Gross Profit per Unit - the gross profit per unit Monthly Pure Product Profit - monthly product revenue - monthly product COGS (The base profit from revenue producing customer shipments when sold by Amazon). Net Pure Product Margin (Net PPM) - (Product Revenue - Product Cogs + VFCC)/Product Revenue Net COGS - (PCOGS - VFCC) Net COGS informs our profit on the product, as VFCC helps offset some of our costs Replenishment out of Stock Rate (ROOS Rate) - measures the rate which Amazon is out of stock P&L-financial statement that summarizes the revenues, costs and expenses incurred during a specific time period. Pure Product Margin (PPM) - (Product Revenue - Product COGS)/Product Revenue Market Segment Share - vendor's sales across all retailers, including Amazon as a percent of total category sales across all retailers, including Amazon. Amazon Share - vendor's sales across Amazon, excluding all other retailers as a percent of total category sales across Amazon, excluding all other retailers. Return on Investment (ROI) the benefit to the investor (Amazon or the Vendor) resulting from an investment of some resource. A high ROI means the investment gains compare favorably to investment cost. Co-op/Vendor Funded Contra Cogs (VFCC) the Deal Promotion funding + Marketing/Merchandising investments we typically receive from vendors to offset costs. Sell thru - ratio of inventory sold to inventory received from supplier. Traffic - the number of visits a webpage receives Vendor Scorecard: Vendor A Vendor A Data Category Average vs. Category Average Sales & Profit Average Monthly Revenue (Jan - Sept) Average Monthly Units (Jan - Sept) Average Monthly Coop Spend (Jan - Sept) Average Monthly Gross Profit (Jan - Sept) Revenue Growth YoY (2 years ago) Revenue Growth YoY (Last Year) Revenue Growth YoY (This Year) Replenishment Oos Rate $5,474,978 50703 $602,670 $410,623 18% 9% 15% $3,341,206 30601 $270,624 $315,876 20% 14% 16% 4% 64% 66% 123% 30% -200 BPS -500 BPS -100 BPS -200 BPS 2% Sales & Profit (Q4 Only Revenue - Q4 Last Year Units - Q4 Last Year Coop Spend - Q4 Last Year Gross Profit - Q4 Last Year $25,139,427 232814 $2,440,810 $1,558,989 $15,436,092 141857 $1,166,030 $1,382,423 63% 64% 109% 13% 1 Revenue Share & Rank Market Segment Size Rank Market Segment Share Amazon Size Rank Amazon Share 34% 1 27% 21% +600 BPS Vendor A is the #1 headphone vendor in the market segment, accounting for 34% of market segment sales; the #1 headphone vendor on Amazon, accounting for 27% of Amazon sales. Vendor A monthly revenue on Amazon is $5.5MM, which is +64% versus category average. Product revenue growth is currently +15% YTD, which is -100 BPS versus the category average. In 04 last year, Vendor A revenue on Amazon was $25.1MM, which was +63% versus category average. Vendor A has become one of the largest vendors by having a wide variety of quality products. Vendor A has mentioned that they may be passing along a product cost increase in November. If not accepted, they will not confirm PO's until the new product costs are accepted. The average cost increase is 5%, whereas the average ASP increase is only 3%. They are open to all forms of COOP and willing to increase their spend by another 20% year over year, along with a Deal of the Day (DOTD) slot in combination with site merchandising. They feel product diversification is key to their success. P&L Case: Example Profits & Losses (P&L) Statement Sen A P&L statement provides a quick overview of a brand's performance and profitability. This statement includes information related to total revenue, cost to Amazon to acquire the products, and additional monies contributed by brands for preferred placement on Amazon's website. Average Monthly Gross Profit Statement - YTD January through September Example Brand 1 Example Brand 2 Example Brand 3 Category Total Units Sold 121,234 50,703 154,201 326,138 *Avg. Sale Price Per Unit (ASP) $ 57.95 $ 37.00 $ 52.40 $ 49.12 =Product Revenue $ 7,025,510.30 $ 1,876,011.00 $ 8,080,132.40 $ 16,981,653.70 Units Sold 121,234 50,703 154,201 326,138 *Average Cost Per Unit (ACU) $ 52.75 $ 35.00 $ 48.35 $ 45.37 =PCOGS $ 6,395,093.50 $ 1,774,605.00 $ 7,455,618.35 $ 15,625,316.85 -Vendor Funded Contra Cogs (Co-op/VFCC) $ 525,201.00 $ 116,533.00 $ 753,290.00 $ 1,395,024.00 = Net COGS $ 5,869,892.50 $ 1,658,072.00 $ 6,702,328.35 $ 14,230,292.85 Product Revenue $ 7,025,510.30 $ 1,876,011.00 $ 8,080,132.40 $ 16,981,653.70 - Net COGS $ 5,869,892.50 $ 1,658,072.00 $ 6,702,328.35 $ 14,230,292.85 =Gross Profit (GP) $ 1,155,617.80 $ 217,939.00 $ 1,377,804.05 $ 2,751,360.85 Retail Computations Overview You will be expected to be able to complete some basic retail computations including overall profitability of a brand. Some examples of the type of computations you will be expected to compute include: Financials/Metrics Average Cost per Unit (ACU) - the average cost per unit for Amazon to acquire the goods, independent of VFCC. Basis Points (BPS) - a common unit of measure for interest rates and other percentages in finance. One basis point is equal to 0.01% (example: 400 basis points = 4%). Product Cost of Goods Sold (PCOGS) - cost of goods sold; this is the cost to Amazon to acquire a product for sale on our website. Gross Profit (GP) - product revenue minus total COGS Gross Profit per Unit - the gross profit per unit Monthly Pure Product Profit - monthly product revenue - monthly product COGS (The base profit from revenue producing customer shipments when sold by Amazon). Net Pure Product Margin (Net PPM) - (Product Revenue - Product Cogs + VFCC)/Product Revenue Net COGS - (PCOGS - VFCC) Net COGS informs our profit on the product, as VFCC helps offset some of our costs Replenishment out of Stock Rate (ROOS Rate) - measures the rate which Amazon is out of stock P&L-financial statement that summarizes the revenues, costs and expenses incurred during a specific time period. Pure Product Margin (PPM) - (Product Revenue - Product COGS)/Product Revenue Market Segment Share - vendor's sales across all retailers, including Amazon as a percent of total category sales across all retailers, including Amazon. Amazon Share - vendor's sales across Amazon, excluding all other retailers as a percent of total category sales across Amazon, excluding all other retailers. Return on Investment (ROI) the benefit to the investor (Amazon or the Vendor) resulting from an investment of some resource. A high ROI means the investment gains compare favorably to investment cost. Co-op/Vendor Funded Contra Cogs (VFCC) the Deal Promotion funding + Marketing/Merchandising investments we typically receive from vendors to offset costs. Sell thru - ratio of inventory sold to inventory received from supplier. Traffic - the number of visits a webpage receives Vendor Scorecard: Vendor A Vendor A Data Category Average vs. Category Average Sales & Profit Average Monthly Revenue (Jan - Sept) Average Monthly Units (Jan - Sept) Average Monthly Coop Spend (Jan - Sept) Average Monthly Gross Profit (Jan - Sept) Revenue Growth YoY (2 years ago) Revenue Growth YoY (Last Year) Revenue Growth YoY (This Year) Replenishment Oos Rate $5,474,978 50703 $602,670 $410,623 18% 9% 15% $3,341,206 30601 $270,624 $315,876 20% 14% 16% 4% 64% 66% 123% 30% -200 BPS -500 BPS -100 BPS -200 BPS 2% Sales & Profit (Q4 Only Revenue - Q4 Last Year Units - Q4 Last Year Coop Spend - Q4 Last Year Gross Profit - Q4 Last Year $25,139,427 232814 $2,440,810 $1,558,989 $15,436,092 141857 $1,166,030 $1,382,423 63% 64% 109% 13% 1 Revenue Share & Rank Market Segment Size Rank Market Segment Share Amazon Size Rank Amazon Share 34% 1 27% 21% +600 BPS Vendor A is the #1 headphone vendor in the market segment, accounting for 34% of market segment sales; the #1 headphone vendor on Amazon, accounting for 27% of Amazon sales. Vendor A monthly revenue on Amazon is $5.5MM, which is +64% versus category average. Product revenue growth is currently +15% YTD, which is -100 BPS versus the category average. In 04 last year, Vendor A revenue on Amazon was $25.1MM, which was +63% versus category average. Vendor A has become one of the largest vendors by having a wide variety of quality products. Vendor A has mentioned that they may be passing along a product cost increase in November. If not accepted, they will not confirm PO's until the new product costs are accepted. The average cost increase is 5%, whereas the average ASP increase is only 3%. They are open to all forms of COOP and willing to increase their spend by another 20% year over year, along with a Deal of the Day (DOTD) slot in combination with site merchandising. They feel product diversification is key to their successStep by Step Solution
There are 3 Steps involved in it
Step: 1

Get Instant Access to Expert-Tailored Solutions
See step-by-step solutions with expert insights and AI powered tools for academic success
Step: 2

Step: 3
Ace Your Homework with AI
Get the answers you need in no time with our AI-driven, step-by-step assistance
Get Started
Management Accounting For Business
Authors: Colin Drury, Mike Tayles
8th Edition
1473778808, 978-1473778801