Answered step by step
Verified Expert Solution
Question
1 Approved Answer
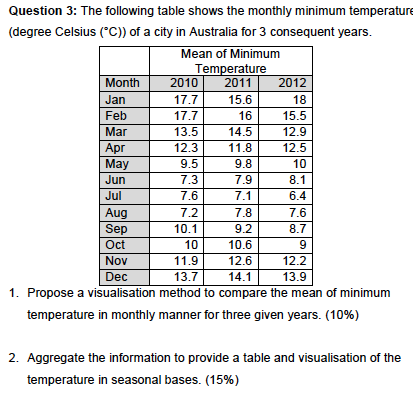
Need to use MATLAB for this question. I am not getting the right kind of graphs for both the questions. MATLAB code used for first
Need to use MATLAB for this question. I am not getting the right kind of graphs for both the questions.
 MATLAB code used for first graph is:
plot(VarName2)
hold on
plot(VarName3)
plot(VarName4)
set(gca,'XTickLabel',{'Jan','Feb','Mar','Apr','May','Jun','Jul','Aug','Sep','Oct','Nov','Dec'});
grid on
xlabel('Months')
ylabel('Temperature(degrees Celcius)')
title('Mean of Monthly Minimum Temperature in Australia')
legend('2010','2011','2012')
The data was typed into an excel file and imported into MATLAB hence the names VarName2,3,4
Question 3: The following table shows the monthly minimum temperature (degree Celsius C)) of a city in Australia for 3 consequent years. Mean of Minimum Temperature Month 2010 2011 2012 Jan 17.7 15.6 18 Feb 17.7 16 15.5 Mar 13.5 14.5 12.9 Apr 12.3 11.8 12.5 May 9.5 9.8 10 Jun 8.1 6.4 Aug 7.2 78 76 Sep 10.1 9.2 Oct 10 10.6 Nov 11.9 12.6 12.2 13.7 14.1 Dec. 13.9 1. Propose a visualisation method to compare the mean of minimum temperature in monthly manner for three given years. (10%) 2. Aggregate the information to provide a table and visualisation of the temperature in seasonal bases. (15%) Question 3: The following table shows the monthly minimum temperature (degree Celsius C)) of a city in Australia for 3 consequent years. Mean of Minimum Temperature Month 2010 2011 2012 Jan 17.7 15.6 18 Feb 17.7 16 15.5 Mar 13.5 14.5 12.9 Apr 12.3 11.8 12.5 May 9.5 9.8 10 Jun 8.1 6.4 Aug 7.2 78 76 Sep 10.1 9.2 Oct 10 10.6 Nov 11.9 12.6 12.2 13.7 14.1 Dec. 13.9 1. Propose a visualisation method to compare the mean of minimum temperature in monthly manner for three given years. (10%) 2. Aggregate the information to provide a table and visualisation of the temperature in seasonal bases. (15%)Step by Step Solution
There are 3 Steps involved in it
Step: 1

Get Instant Access to Expert-Tailored Solutions
See step-by-step solutions with expert insights and AI powered tools for academic success
Step: 2

Step: 3

Ace Your Homework with AI
Get the answers you need in no time with our AI-driven, step-by-step assistance
Get Started


