NEED URGANT HELP PLEASE
this an excel projec
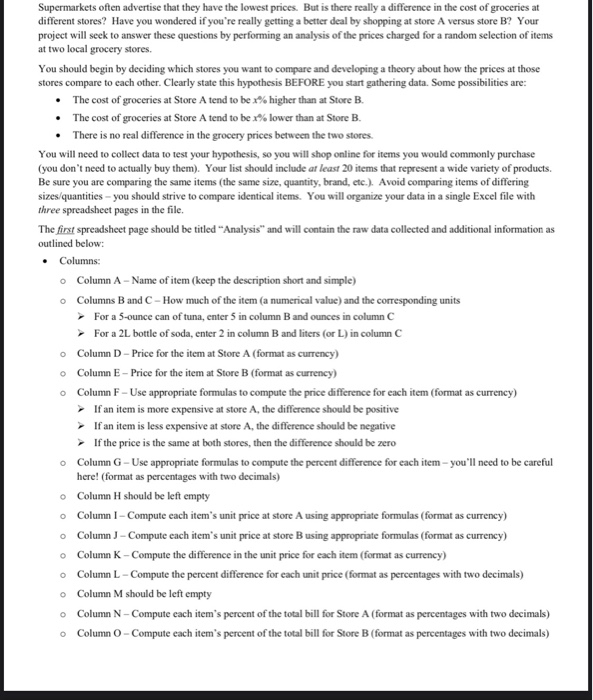
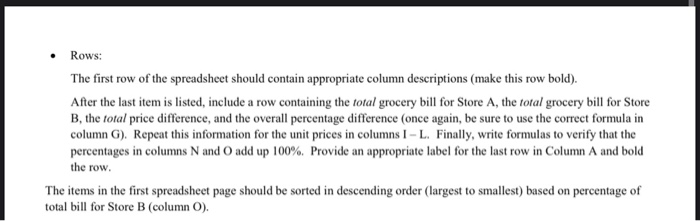
Supermarkets often advertise that they have the lowest prices. But is there really a difference in the cost of groceries at different stores? Have you wondered if you're really getting a better deal by shopping at store A versus store B? Your project will seek to answer these questions by performing an analysis of the prices charged for a random selection of items at two local grocery stores. You should begin by deciding which stores you want to compare and developing a theory about how the prices at those stores compare to each other. Clearly state this hypothesis BEFORE you start gathering data. Some possibilities are: The cost of groceries at Store A tend to be.x% higher than at Store B The cost of groceries at Store A tend to be x% lower than at Store B. There is no real difference in the grocery prices between the two stores You will need to collect data to test your hypothesis, so you will shop online for items you would commonly purchase (you don't need to actually buy them). Your list should include at least 20 items that represent a wide variety of products, Be sure you are comparing the same items (the same size, quantity, brand, etc.). Avoid comparing items of differing sizes/quantities - you should strive to compare identical items. You will organize your data in a single Excel file with three spreadsheet pages in the file. The first spreadsheet page should be titled "Analysis" and will contain the raw data collected and additional information as outlined below: Columns: o Column A -Name of item (keep the description short and simple) O Columns B and C - How much of the item (a numerical value) and the corresponding units For a 5-ounce can of tuna, enter 5 in column B and ounces in column C For a 2L bottle of soda, enter 2 in column B and liters (or L) in column o Column D - Price for the item at Store A (format as currency) o Column E-Price for the item at Store B (format as currency) o Column F- Use appropriate formulas to compute the price difference for each item (format as currency) If an item is more expensive at store A, the difference should be positive If an item is less expensive at store A, the difference should be negative If the price is the same at both stores, then the difference should be zero o Column G - Use appropriate formulas to compute the percent difference for each item - you'll need to be careful here! (format as percentages with two decimals) o Column H should be left empty o Column 1 - Compute each item's unit price at store A using appropriate formulas (format as currency) o Column - Compute each item's unit price at store B using appropriate formulas (format as currency) o Column K-Compute the difference in the unit price for each item (format as currency) o Column L-Compute the percent difference for each unit price (format as percentages with two decimals) o Column M should be left empty o Column N-Compute each item's percent of the total bill for Store A (format as percentages with two decimals) o Column - Compute each item's percent of the total bill for Store B (format as percentages with two decimals) Rows: The first row of the spreadsheet should contain appropriate column descriptions (make this row bold). After the last item is listed, include a row containing the total grocery bill for Store A, the total grocery bill for Store B, the total price difference, and the overall percentage difference (once again, be sure to use the correct formula in column G). Repeat this information for the unit prices in columns I-L. Finally, write formulas to verify that the percentages in columns N and O add up 100%. Provide an appropriate label for the last row in Column A and bold the row. The items in the first spreadsheet page should be sorted in descending order (largest to smallest) based on percentage of total bill for Store B (column O). Spreadsheet 1 - Price Comparison (63 pts) Column F - Price Difference Column G - Percent Difference Column 1 - Unit Price for Store A Column ) - Unit Price for Store B Column K - Unit Price Difference Column L- Unit Price % Difference Column N - Percent of Bill A Column - Percent of Bill B Summary Row Formatting/Sorting/Sheet Titles Supermarkets often advertise that they have the lowest prices. But is there really a difference in the cost of groceries at different stores? Have you wondered if you're really getting a better deal by shopping at store A versus store B? Your project will seek to answer these questions by performing an analysis of the prices charged for a random selection of items at two local grocery stores. You should begin by deciding which stores you want to compare and developing a theory about how the prices at those stores compare to each other. Clearly state this hypothesis BEFORE you start gathering data. Some possibilities are: The cost of groceries at Store A tend to be.x% higher than at Store B The cost of groceries at Store A tend to be x% lower than at Store B. There is no real difference in the grocery prices between the two stores You will need to collect data to test your hypothesis, so you will shop online for items you would commonly purchase (you don't need to actually buy them). Your list should include at least 20 items that represent a wide variety of products, Be sure you are comparing the same items (the same size, quantity, brand, etc.). Avoid comparing items of differing sizes/quantities - you should strive to compare identical items. You will organize your data in a single Excel file with three spreadsheet pages in the file. The first spreadsheet page should be titled "Analysis" and will contain the raw data collected and additional information as outlined below: Columns: o Column A -Name of item (keep the description short and simple) O Columns B and C - How much of the item (a numerical value) and the corresponding units For a 5-ounce can of tuna, enter 5 in column B and ounces in column C For a 2L bottle of soda, enter 2 in column B and liters (or L) in column o Column D - Price for the item at Store A (format as currency) o Column E-Price for the item at Store B (format as currency) o Column F- Use appropriate formulas to compute the price difference for each item (format as currency) If an item is more expensive at store A, the difference should be positive If an item is less expensive at store A, the difference should be negative If the price is the same at both stores, then the difference should be zero o Column G - Use appropriate formulas to compute the percent difference for each item - you'll need to be careful here! (format as percentages with two decimals) o Column H should be left empty o Column 1 - Compute each item's unit price at store A using appropriate formulas (format as currency) o Column - Compute each item's unit price at store B using appropriate formulas (format as currency) o Column K-Compute the difference in the unit price for each item (format as currency) o Column L-Compute the percent difference for each unit price (format as percentages with two decimals) o Column M should be left empty o Column N-Compute each item's percent of the total bill for Store A (format as percentages with two decimals) o Column - Compute each item's percent of the total bill for Store B (format as percentages with two decimals) Rows: The first row of the spreadsheet should contain appropriate column descriptions (make this row bold). After the last item is listed, include a row containing the total grocery bill for Store A, the total grocery bill for Store B, the total price difference, and the overall percentage difference (once again, be sure to use the correct formula in column G). Repeat this information for the unit prices in columns I-L. Finally, write formulas to verify that the percentages in columns N and O add up 100%. Provide an appropriate label for the last row in Column A and bold the row. The items in the first spreadsheet page should be sorted in descending order (largest to smallest) based on percentage of total bill for Store B (column O). Spreadsheet 1 - Price Comparison (63 pts) Column F - Price Difference Column G - Percent Difference Column 1 - Unit Price for Store A Column ) - Unit Price for Store B Column K - Unit Price Difference Column L- Unit Price % Difference Column N - Percent of Bill A Column - Percent of Bill B Summary Row Formatting/Sorting/Sheet Titles