

Answered step by step
Verified Expert Solution
Question
1 Approved Answer
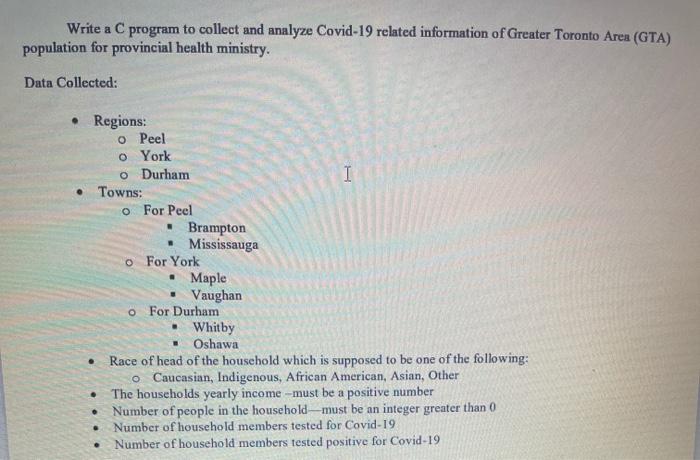
need urgently Write a C program to collect and analyze Covid-19 related information of Greater Toronto Area (GTA) population for provincial health ministry. Data Collected:
need urgently
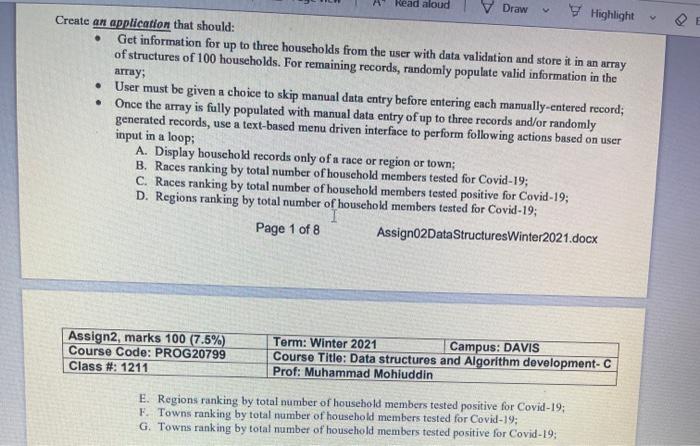
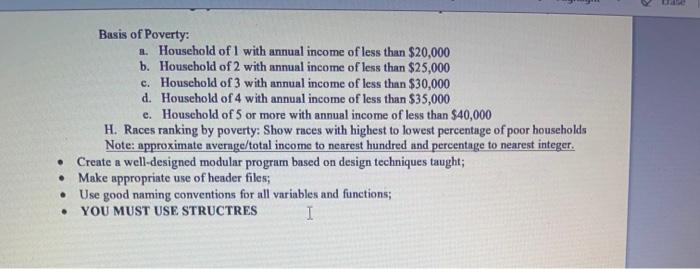
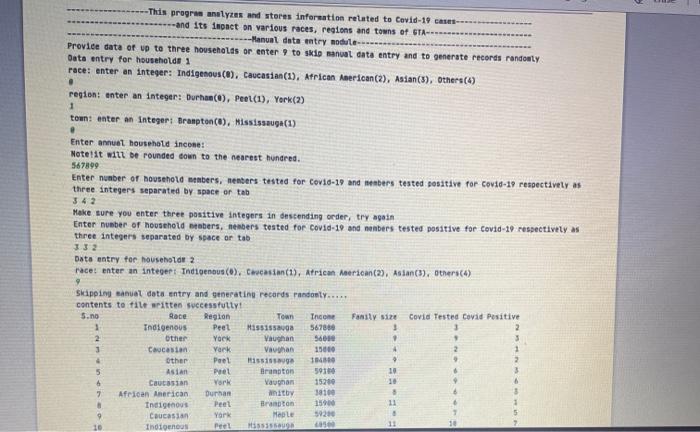
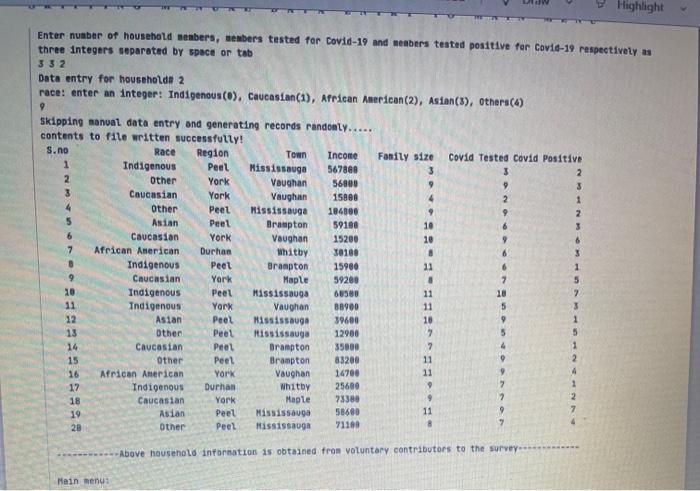
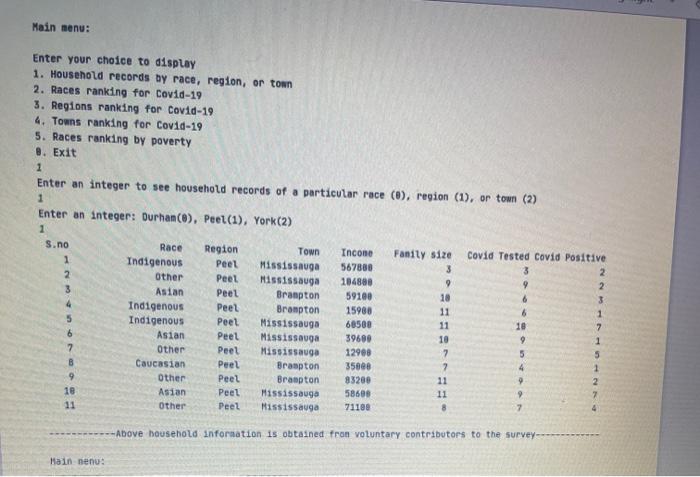
Write a C program to collect and analyze Covid-19 related information of Greater Toronto Area (GTA) population for provincial health ministry. Data Collected: I Regions: O Peel o York o Durham Towns: o For Peel Brampton Mississauga o For York Maple Vaughan o For Durham Whitby Oshawa Race of head of the household which is supposed to be one of the following: o Caucasian, Indigenous, African American, Asian, Other The households yearly income -must be a positive number Number of people in the householdmust be an integer greater than 0 Number of household members tested for Covid-19 Number of household members tested positive for Covid-19 . Read aloud V Draw V Highlight . . Create an application that should: Get information for up to three households from the user with data validation and store it in an array of structures of 100 households. For remaining records, randomly populate valid information in the array; User must be given a choice to skip manual data entry before entering each manually entered record; Once the array is fully populated with manual data entry of up to three records and/or randomly generated records, use a text-based menu driven interface to perform following actions based on user input in a loop; A. Display household records only of a race or region or town; B. Races ranking by total number of houschold members tested for Covid-19; C. Races ranking by total number of household members tested positive for Covid-19; D. Regions ranking by total number of household members tested for Covid-19; Page 1 of 8 Assigno2Data Structures Winter 2021.docx Assign2, marks 100 (7.5%) Course Code: PROG 20799 Class #: 1211 Term: Winter 2021 Campus: DAVIS Course Title: Data structures and Algorithm development-C Prof: Muhammad Mohiuddin E. Regions ranking by total number of household members tested positive for Covid-19; F. Towns ranking by total number of household members tested for Covid-19; G. Towns ranking by total number of household members tested positive for Covid-19; Basis of Poverty: Household of 1 with annual income of less than $20,000 b. Household of 2 with annual income of less than $25,000 c. Houschold of 3 with annual income of less than $30,000 d. Household of 4 with annual income of less than $35,000 e. Household of 5 or more with annual income of less than $40,000 H. Races ranking by poverty: Show races with highest to lowest percentage of poor households Note: approximate average/total income to nearest hundred and percentage to nearest integer Create a well-designed modular program based on design techniques taught; Make appropriate use of header files; Use good naming conventions for all variables and functions; YOU MUST USE STRUCTRES 1 . . . -This progres analyzes and stores information related to Cavid-19 cases. --and its impact on various races, regions and towns of CTA--- Manual data entry module Provide data of up to three households or enter to skip manual data entry and to generate records randomly Data entry for households 1 race: enter an integer: Indigenous(8), Caucasian(1), African American(2), Asian(3), Others (4) . region: enter an integer: Durham (0), Peel(1), York(2) town: enter an integeri Branpton(s). Mississauga (1) e Enter annuel household incone! Notelit will be rounded down to the nearest hundred. 567899 Enter nunber of household nenbers, Henders tested for Covio-19 and members tested positive for Cov16-19 respectively three integers separated by space or tab 342 Make sure you enter three positive integers in descending order, try again Enter number of household bers, nenbers tested for covid-19 and nonbers tested positive for Cavid-19 respectively as three integers separated by space or tab JJ2 Data entry for household 2 racet enter an integert Tndigenous (O), Cavcasian(1), African Aerican(2), Asian), Others (4) 9 Skipping anual data entry and generating records randonly.... contents to file written successfully! 5.10 Race Region Town Income Family Covid Tested Cavid Positive . Tndigenous Peet M155155 567880 2 2 Other Yok Vaughan 5601 . 3 3 Caucasian Vark Vahan 15000 1 Other Poet 1551 1943 2 5 Asian Pret Brampton 5910 10 6 Caucasian York Vaughan 15200 3 African American Durham itby 38100 5 Indigenous Peet Braton 15900 11 Caucasian York Maple 59200 10 Indigenous 5535 Highlight Enter number of household seabers, members tested for Cavid-19 and members tested positive for Covie-19 respectively as three integers separated by space or tab 3 3 2 Data entry for householde 2 race: enter an integer: Indigenous (8), Caucasian(1), African American(2), Asian(s), others () 9 skipping manual data entry and generating records randonly..... contents to file written successfully! S.no Race Region Town Income Fanily size Covid Tested Covid Positive 1 Indigenous Peet Mississauga 567860 3 2 2 Other York Vaughan 56800 9 3 3 Caucasian York Vaughan 15880 4 2 1 4 Other Peet Mississauga 184880 9 9 2 5 Asian Peet Brampton 59190 10 8 3 6 Caucasian York Vaughan 15200 10 6 7 African American Durhan Whitby 30160 6 3 8 Indigenous Peel Brampton 15900 11 6 1 9 Caucasian York Maple 59280 8 7 20 Indigenous Peet Mississauga 60380 11 10 7 11 Indigenous York Vaughan 38980 11 5 3 12 Asian Peel Mississauga 39680 10 9 1 13 Other Peet Mississauga 12900 7 5 5 14 Caucasian Peel Brampton 35800 7 4 1 15 Other Peet Brampton 83200 11 9 2 16 African American York 4 14790 Vaughan 11 17 Indigenous Durham Whitby 25689 1 7 Caucasian 18 York 9 73389 Maple 2 2 19 Asian Peet 58680 11 9 Mississauga 7 20 Other Peet 7 8 71100 Mississauga 9 --Above household information is obtained from voluntary contributors to the survey Main menu Main menu: Enter your choice to display 1. Household records by race, region, or town 2. Races ranking for Covid-19 3. Regions ranking for Covid-19 4. Towns ranking for Covid-19 5. Races ranking by poverty 8. Exit 1 Enter an integer to see household records of a particular race (), region (1), or town (2) 1 Enter an integer: Ourhan(), Peel(1), York(2) 1 S.no Race Region Town Income Fanity size Covid Tested Covid Positive 1 Indigenous Peel Mississauga 567880 3 3 2 2 Other Peel Mississauga 104880 9 9 2 3 Asian Peel Brampton 59100 10 6 3 4 Indigenous Peel Brompton 15980 11 6 1 Indigenous Peel Mississauga 60500 11 10 7 Asian Peet Mississauga 39600 10 9 1 Other Peel Mississauga 12999 7 5 5 Caucasian 8 Peel Brampton 35808 7 4 1 9 Other Peel Brampton 9 83200 11 2 18 Asian Peel Mississaugo 58608 11 Peet 4 Other Mississauga 8 71188 7 5 6 7 -Above household information is obtained from voluntary contributors to the survey -------- Hain nenu Write a C program to collect and analyze Covid-19 related information of Greater Toronto Area (GTA) population for provincial health ministry. Data Collected: I Regions: O Peel o York o Durham Towns: o For Peel Brampton Mississauga o For York Maple Vaughan o For Durham Whitby Oshawa Race of head of the household which is supposed to be one of the following: o Caucasian, Indigenous, African American, Asian, Other The households yearly income -must be a positive number Number of people in the householdmust be an integer greater than 0 Number of household members tested for Covid-19 Number of household members tested positive for Covid-19 . Read aloud V Draw V Highlight . . Create an application that should: Get information for up to three households from the user with data validation and store it in an array of structures of 100 households. For remaining records, randomly populate valid information in the array; User must be given a choice to skip manual data entry before entering each manually entered record; Once the array is fully populated with manual data entry of up to three records and/or randomly generated records, use a text-based menu driven interface to perform following actions based on user input in a loop; A. Display household records only of a race or region or town; B. Races ranking by total number of houschold members tested for Covid-19; C. Races ranking by total number of household members tested positive for Covid-19; D. Regions ranking by total number of household members tested for Covid-19; Page 1 of 8 Assigno2Data Structures Winter 2021.docx Assign2, marks 100 (7.5%) Course Code: PROG 20799 Class #: 1211 Term: Winter 2021 Campus: DAVIS Course Title: Data structures and Algorithm development-C Prof: Muhammad Mohiuddin E. Regions ranking by total number of household members tested positive for Covid-19; F. Towns ranking by total number of household members tested for Covid-19; G. Towns ranking by total number of household members tested positive for Covid-19; Basis of Poverty: Household of 1 with annual income of less than $20,000 b. Household of 2 with annual income of less than $25,000 c. Houschold of 3 with annual income of less than $30,000 d. Household of 4 with annual income of less than $35,000 e. Household of 5 or more with annual income of less than $40,000 H. Races ranking by poverty: Show races with highest to lowest percentage of poor households Note: approximate average/total income to nearest hundred and percentage to nearest integer Create a well-designed modular program based on design techniques taught; Make appropriate use of header files; Use good naming conventions for all variables and functions; YOU MUST USE STRUCTRES 1 . . . -This progres analyzes and stores information related to Cavid-19 cases. --and its impact on various races, regions and towns of CTA--- Manual data entry module Provide data of up to three households or enter to skip manual data entry and to generate records randomly Data entry for households 1 race: enter an integer: Indigenous(8), Caucasian(1), African American(2), Asian(3), Others (4) . region: enter an integer: Durham (0), Peel(1), York(2) town: enter an integeri Branpton(s). Mississauga (1) e Enter annuel household incone! Notelit will be rounded down to the nearest hundred. 567899 Enter nunber of household nenbers, Henders tested for Covio-19 and members tested positive for Cov16-19 respectively three integers separated by space or tab 342 Make sure you enter three positive integers in descending order, try again Enter number of household bers, nenbers tested for covid-19 and nonbers tested positive for Cavid-19 respectively as three integers separated by space or tab JJ2 Data entry for household 2 racet enter an integert Tndigenous (O), Cavcasian(1), African Aerican(2), Asian), Others (4) 9 Skipping anual data entry and generating records randonly.... contents to file written successfully! 5.10 Race Region Town Income Family Covid Tested Cavid Positive . Tndigenous Peet M155155 567880 2 2 Other Yok Vaughan 5601 . 3 3 Caucasian Vark Vahan 15000 1 Other Poet 1551 1943 2 5 Asian Pret Brampton 5910 10 6 Caucasian York Vaughan 15200 3 African American Durham itby 38100 5 Indigenous Peet Braton 15900 11 Caucasian York Maple 59200 10 Indigenous 5535 Highlight Enter number of household seabers, members tested for Cavid-19 and members tested positive for Covie-19 respectively as three integers separated by space or tab 3 3 2 Data entry for householde 2 race: enter an integer: Indigenous (8), Caucasian(1), African American(2), Asian(s), others () 9 skipping manual data entry and generating records randonly..... contents to file written successfully! S.no Race Region Town Income Fanily size Covid Tested Covid Positive 1 Indigenous Peet Mississauga 567860 3 2 2 Other York Vaughan 56800 9 3 3 Caucasian York Vaughan 15880 4 2 1 4 Other Peet Mississauga 184880 9 9 2 5 Asian Peet Brampton 59190 10 8 3 6 Caucasian York Vaughan 15200 10 6 7 African American Durhan Whitby 30160 6 3 8 Indigenous Peel Brampton 15900 11 6 1 9 Caucasian York Maple 59280 8 7 20 Indigenous Peet Mississauga 60380 11 10 7 11 Indigenous York Vaughan 38980 11 5 3 12 Asian Peel Mississauga 39680 10 9 1 13 Other Peet Mississauga 12900 7 5 5 14 Caucasian Peel Brampton 35800 7 4 1 15 Other Peet Brampton 83200 11 9 2 16 African American York 4 14790 Vaughan 11 17 Indigenous Durham Whitby 25689 1 7 Caucasian 18 York 9 73389 Maple 2 2 19 Asian Peet 58680 11 9 Mississauga 7 20 Other Peet 7 8 71100 Mississauga 9 --Above household information is obtained from voluntary contributors to the survey Main menu Main menu: Enter your choice to display 1. Household records by race, region, or town 2. Races ranking for Covid-19 3. Regions ranking for Covid-19 4. Towns ranking for Covid-19 5. Races ranking by poverty 8. Exit 1 Enter an integer to see household records of a particular race (), region (1), or town (2) 1 Enter an integer: Ourhan(), Peel(1), York(2) 1 S.no Race Region Town Income Fanity size Covid Tested Covid Positive 1 Indigenous Peel Mississauga 567880 3 3 2 2 Other Peel Mississauga 104880 9 9 2 3 Asian Peel Brampton 59100 10 6 3 4 Indigenous Peel Brompton 15980 11 6 1 Indigenous Peel Mississauga 60500 11 10 7 Asian Peet Mississauga 39600 10 9 1 Other Peel Mississauga 12999 7 5 5 Caucasian 8 Peel Brampton 35808 7 4 1 9 Other Peel Brampton 9 83200 11 2 18 Asian Peel Mississaugo 58608 11 Peet 4 Other Mississauga 8 71188 7 5 6 7 -Above household information is obtained from voluntary contributors to the survey -------- Hain nenu Step by Step Solution
There are 3 Steps involved in it
Step: 1

Get Instant Access to Expert-Tailored Solutions
See step-by-step solutions with expert insights and AI powered tools for academic success
Step: 2

Step: 3
Ace Your Homework with AI
Get the answers you need in no time with our AI-driven, step-by-step assistance
Get Started
Machine Learning And Knowledge Discovery In Databases Applied Data Science Track European Conference Ecml Pkdd 2021 Bilbao Spain September 13 17 2021 Proceedings Part 5 Lnai 12979
Authors: Yuxiao Dong ,Nicolas Kourtellis ,Barbara Hammer ,Jose A. Lozano
1st Edition
3030865169, 978-3030865160