Answered step by step
Verified Expert Solution
Link Copied!

Question

1 Approved Answer

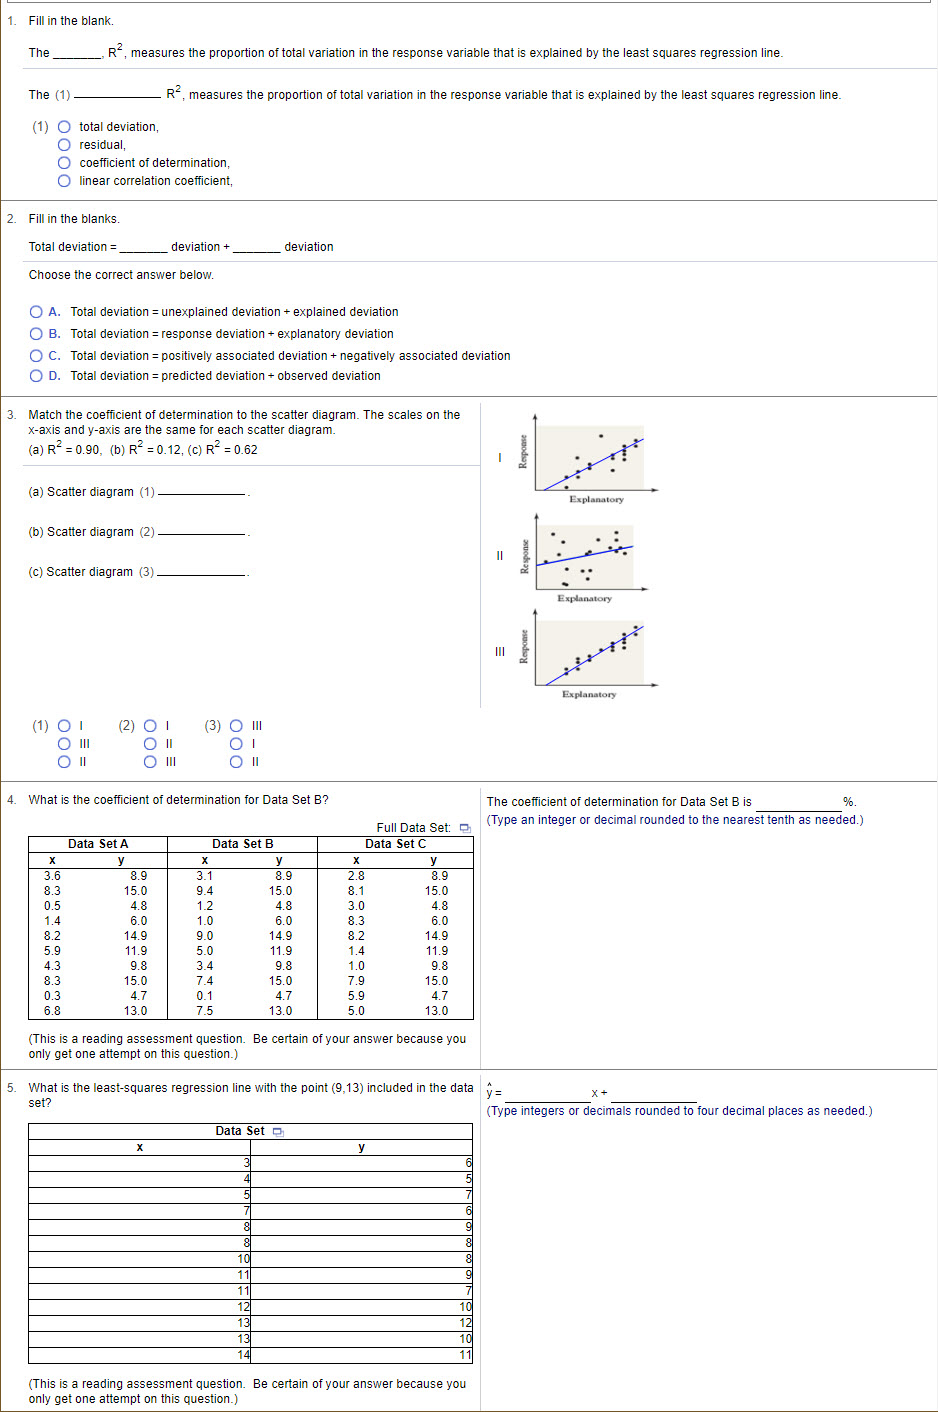
Needing help with Statistics Homework!!! Unit 8 - Section 4.3 1. Fill in the blank. The R, measures the proportion of total variation in the

Needing help with Statistics Homework!!!

Unit 8 - Section 4.3

image text in transcribed
1. Fill in the blank. The R, measures the proportion of total variation in the response variable that is explained by the least squares regression line. The (1) R", measures the proportion of total variation in the response variable that is explained by the least squares regression line. (1) O total deviation, DO residual coefficient of determination, O linear correlation coefficient, . Fill in the blanks. Total deviation = deviation + deviation Choose the correct answer below. O A. Total deviation = unexplained deviation + explained deviation O B. Total deviation = response deviation + explanatory deviation O C. Total deviation = positively associated deviation + negatively associated deviation O D. Total deviation = predicted deviation + observed deviation Match the coefficient of determination to the scatter diagram. The scales on the x-axis and y-axis are the same for each scatter diagram. (a) R" = 0.90, (b) R

Step by Step Solution

There are 3 Steps involved in it

Step: 1

blur-text-image

Get Instant Access to Expert-Tailored Solutions

See step-by-step solutions with expert insights and AI powered tools for academic success

Step: 2

blur-text-image

Step: 3

blur-text-image

Ace Your Homework with AI

Get the answers you need in no time with our AI-driven, step-by-step assistance

Get Started

Recommended Textbook for

Chaos, Noise And Fractals

Authors: E Roy Pike, L A Lugiato

1st Edition

1000112101, 9781000112108

More Books

Students also viewed these Mathematics questions