needs to be coded in matlab!
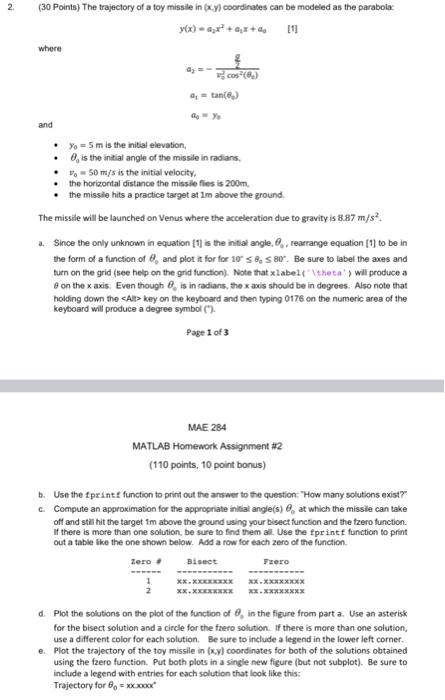
2 (30 Points) The trajectory of a toy missile in (Y) coordinates can be modeled as the parabola y(x) = x + x + where cos (6) Qan() and Yo = 5 m is the initial elevation, 0, is the initial angle of the missile in radians, - 50m/s is the initial velocity the horizontal distance the missile flies is 200m the missie hits a practice target at Im above the ground, The missile will be launched on Venus where the acceleration due to gravity is 8.87m/s? a. Since the only unknown in equation [1's the initial angle. Crearrange equation (1) to be in the form of a function of , and plot a for for 10 58.580. Be sure to label the axes and turn on the grid (see help on the grid function). Note that xlabel("\theta' wil produce a on the x axis. Even though is in radians, the xaxis should be in degrees. Also note that holding down the
key on the keyboard and then typing 0176 on the numeric area of the keyboard will produce a degree symbol ("). Page 1 of 3 MAE 284 MATLAB Homework Assignment #2 (110 points, 10 point bonus) b. Use the fprintf function to print out the answer to the question: "How many solutions exist? c. Compute an approximation for the appropriate initial angle(s) 0 at which the missie can take off and still hit the target im above the ground using your bisect function and the zero function If there is more than one solution, be sure to find them all Use the fprintf function to print out a table like the one shown below. Add a row for each zero of the function Zero Bisect zero XXXXXXXXXX XX.XXXXXXX XX.XX****** Plot the solutions on the plot of the function of in the figure from parta. Use an asterisk for the bisect solution and a circle for the frero solution. If there is more than one solution, use a different color for each solution. Be sure to include a legend in the lower left corner. e. Plot the trajectory of the toy missile in (x,y) coordinates for both of the solutions obtained using the fzero function. Put both plots in a single new figure (but not subplot). Be sure to include a legend with entries for each solution that look like this: Trajectory for 8, = xx.x200 2 (30 Points) The trajectory of a toy missile in (Y) coordinates can be modeled as the parabola y(x) = x + x + where cos (6) Qan() and Yo = 5 m is the initial elevation, 0, is the initial angle of the missile in radians, - 50m/s is the initial velocity the horizontal distance the missile flies is 200m the missie hits a practice target at Im above the ground, The missile will be launched on Venus where the acceleration due to gravity is 8.87m/s? a. Since the only unknown in equation [1's the initial angle. Crearrange equation (1) to be in the form of a function of , and plot a for for 10 58.580. Be sure to label the axes and turn on the grid (see help on the grid function). Note that xlabel("\theta' wil produce a on the x axis. Even though is in radians, the xaxis should be in degrees. Also note that holding down the key on the keyboard and then typing 0176 on the numeric area of the keyboard will produce a degree symbol ("). Page 1 of 3 MAE 284 MATLAB Homework Assignment #2 (110 points, 10 point bonus) b. Use the fprintf function to print out the answer to the question: "How many solutions exist? c. Compute an approximation for the appropriate initial angle(s) 0 at which the missie can take off and still hit the target im above the ground using your bisect function and the zero function If there is more than one solution, be sure to find them all Use the fprintf function to print out a table like the one shown below. Add a row for each zero of the function Zero Bisect zero XXXXXXXXXX XX.XXXXXXX XX.XX****** Plot the solutions on the plot of the function of in the figure from parta. Use an asterisk for the bisect solution and a circle for the frero solution. If there is more than one solution, use a different color for each solution. Be sure to include a legend in the lower left corner. e. Plot the trajectory of the toy missile in (x,y) coordinates for both of the solutions obtained using the fzero function. Put both plots in a single new figure (but not subplot). Be sure to include a legend with entries for each solution that look like this: Trajectory for 8, = xx.x200


