

Answered step by step
Verified Expert Solution
Question
1 Approved Answer
needs to be done on excel The financial statements of Dandy Distributors Ltd. are shown on the Fcl. Stmts. page. Required: 1 Based on Dandy's
needs to be done on excel
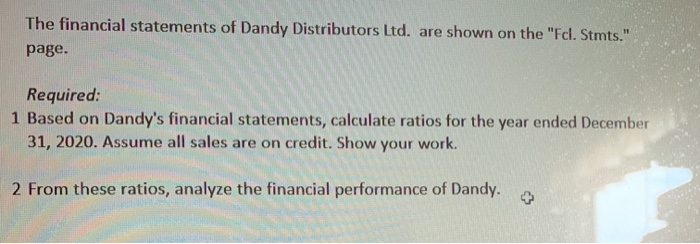
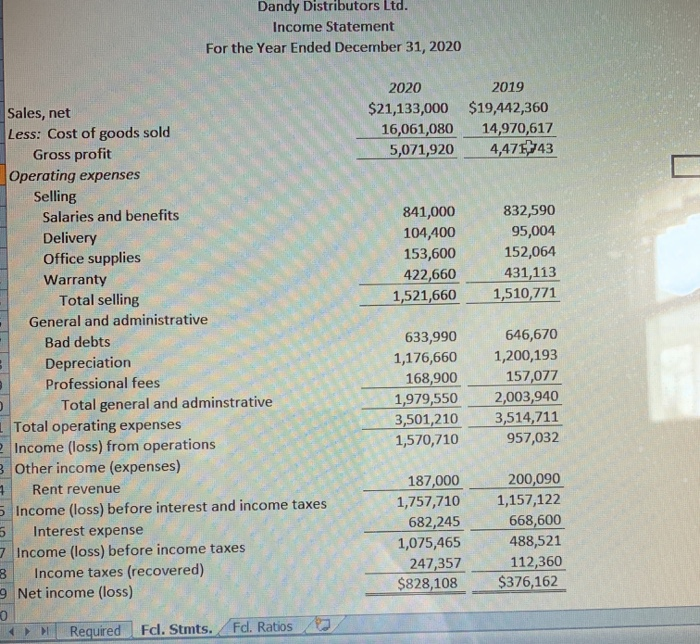
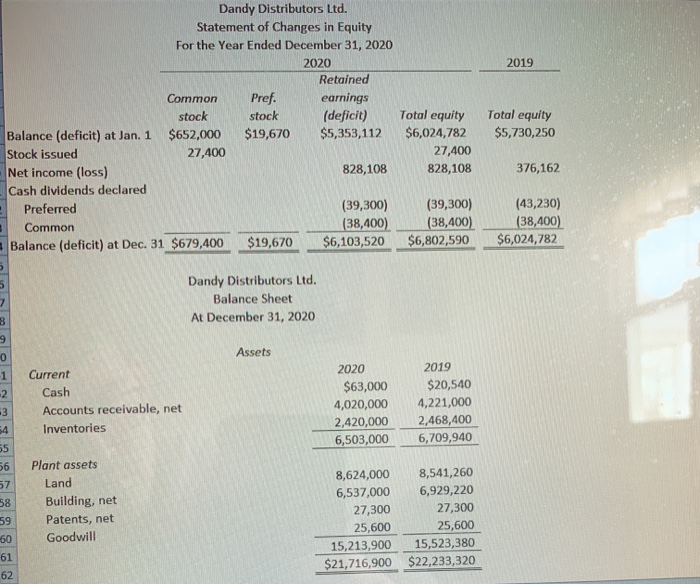
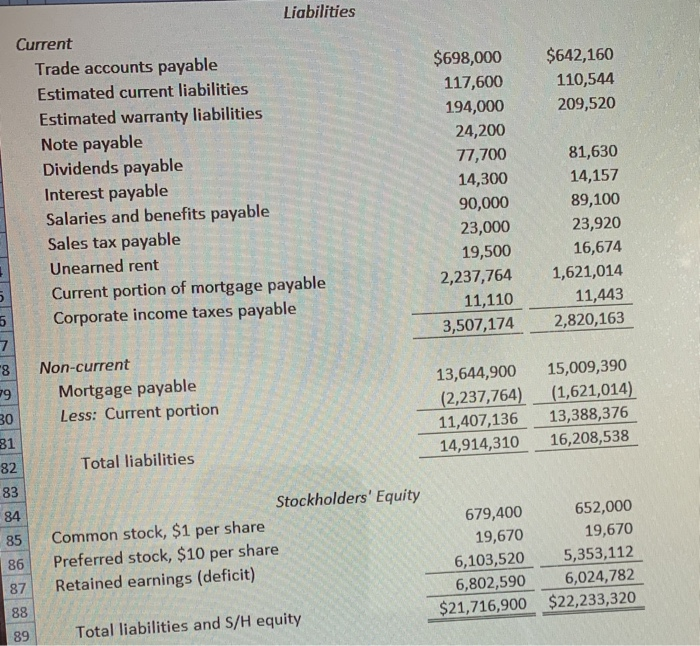
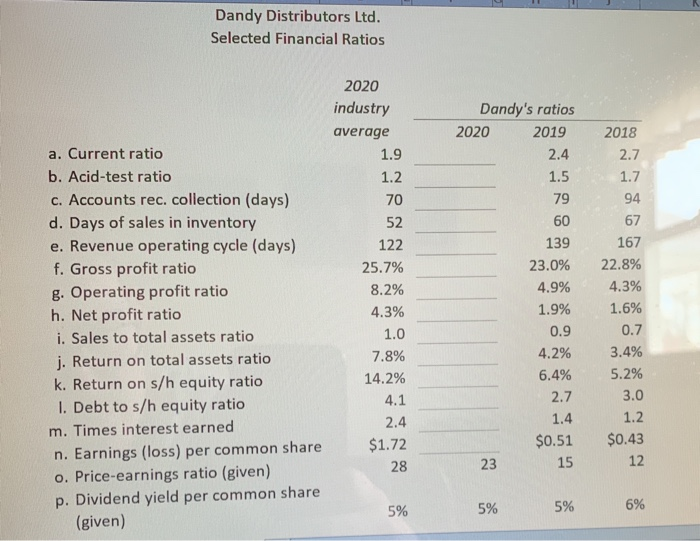
The financial statements of Dandy Distributors Ltd. are shown on the "Fcl. Stmts." page. Required: 1 Based on Dandy's financial statements, calculate ratios for the year ended December 31, 2020. Assume all sales are on credit. Show your work. 2 From these ratios, analyze the financial performance of Dandy. Dandy Distributors Ltd. Income Statement For the Year Ended December 31, 2020 2020 $21,133,000 16,061,080 5,071,920 2019 $19,442,360 14,970,617 4,47143 841,000 104,400 153,600 422,660 1,521,660 832,590 95,004 152,064 4 31,113 1,510,771 Sales, net Less: Cost of goods sold Gross profit Operating expenses Selling Salaries and benefits Delivery Office supplies Warranty Total selling General and administrative Bad debts Depreciation Professional fees Total general and adminstrative 1 Total operating expenses Income (loss) from operations 3 Other income (expenses) Rent revenue 5 Income (loss) before interest and income taxes 5 Interest expense 7 Income (loss) before income taxes 8 Income taxes (recovered) 9 Net income (loss) 0 Required Fcl. Stmts. Fd. Ratios 633,990 1,176,660 168,900 1,979,550 3,501,210 1,570,710 646,670 1,200,193 157,077 2,003,940 3,514,711 957,032 152 187,000 1,757,710 682,245 1,075,465 247,357 $828,108 200,090 1,157,122 668,600 488,521 112,360 $376,162 2019 Dandy Distributors Ltd. Statement of Changes in Equity For the Year Ended December 31, 2020 2020 Retained Common Pref. earnings stock stock (deficit) Balance (deficit) at Jan. 1 $652,000 $19,670 $5,353,112 Stock issued 27,400 Net income (loss) 828,108 Cash dividends declared Preferred (39,300) Common (38,400) Balance (deficit) at Dec. 31 $679,400 $19,670 $6,103,520 Total equity $5,730,250 Total equity $6,024,782 27,400 828,108 376,162 (39,300) (38,400) $6,802,590 (43,230) (38,400) $6,024,782 Dandy Distributors Ltd. Balance Sheet At December 31, 2020 in innom Assets Current Cash Accounts receivable, net Inventories 2020 $63,000 4,020,000 2,420,000 6,503,000 2019 $20,540 4,221,000 2,468,400 6,709,940 Plant assets Land Building, net Patents, net Goodwill 8,624,000 6,537,000 27,300 25,600 15,213,900 $21,716,900 8,541,260 6,929,220 27,300 25,600 15,523,380 $22,233,320 Sg $642,160 110,544 209,520 Liabilities Current Trade accounts payable Estimated current liabilities Estimated warranty liabilities Note payable Dividends payable Interest payable Salaries and benefits payable Sales tax payable Unearned rent Current portion of mortgage payable Corporate income taxes payable $698,000 117,600 194,000 24,200 77,700 14,300 90,000 23,000 19,500 2,237,764 11,110 3,507,174 81,630 14,157 89,100 23,920 16,674 1,621,014 11,443 2,820,163 Non-current Mortgage payable Less: Current portion 13,644,900 (2,237,764) 11,407,136 14,914,310 15,009,390 (1,621,014) 13,388,376 16,208,538 Total liabilities 35 36 37 38 89 Stockholders' Equity Common stock, $1 per share Preferred stock, $10 per share Retained earnings (deficit) 679,400 19,670 6,103,520 6,802,590 $21,716,900 652,000 19,670 5,353,112 6,024,782 $22,233,320 Total liabilities and S/H equity Dandy Distributors Ltd. Selected Financial Ratios 2020 industry average 1.9 Dandy's ratios 2020 2019 2018 2.4 1.5 1.7 139 23.0% 4.9% 1.9% a. Current ratio b. Acid-test ratio C. Accounts rec. collection (days) d. Days of sales in inventory e. Revenue operating cycle (days) f. Gross profit ratio g. Operating profit ratio h. Net profit ratio i. Sales to total assets ratio j. Return on total assets ratio k. Return on s/h equity ratio 1. Debt to s/h equity ratio m. Times interest earned n. Earnings (loss) per common share o. Price-earnings ratio (given) p. Dividend yield per common share (given) 52 122 25.7% 8.2% 4.3% 1.0 7.8% 14.2% 4.1 2.4 $1.72 0.9 167 22.8% 4.3% 1.6% 0.7 3.4% 5.2% 3.0 1.2 $0.43 4.2% 6.4% 2.7 1.4 $0.51 15 23 12 5% 5% 5% 6% Step by Step Solution
There are 3 Steps involved in it
Step: 1

Get Instant Access to Expert-Tailored Solutions
See step-by-step solutions with expert insights and AI powered tools for academic success
Step: 2

Step: 3
Ace Your Homework with AI
Get the answers you need in no time with our AI-driven, step-by-step assistance
Get Started
Key Concepts In Primary Science Audit And Subject Knowledge
Authors: Vivian Cooke, Colin Howard
1st Edition
1910391506, 978-1910391501