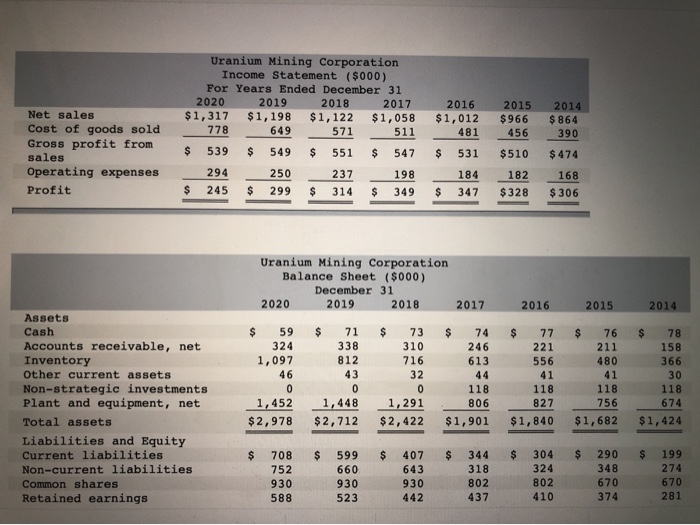
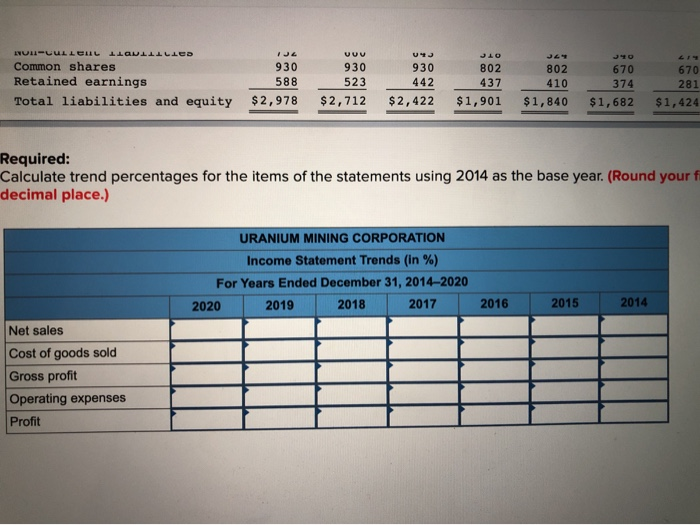
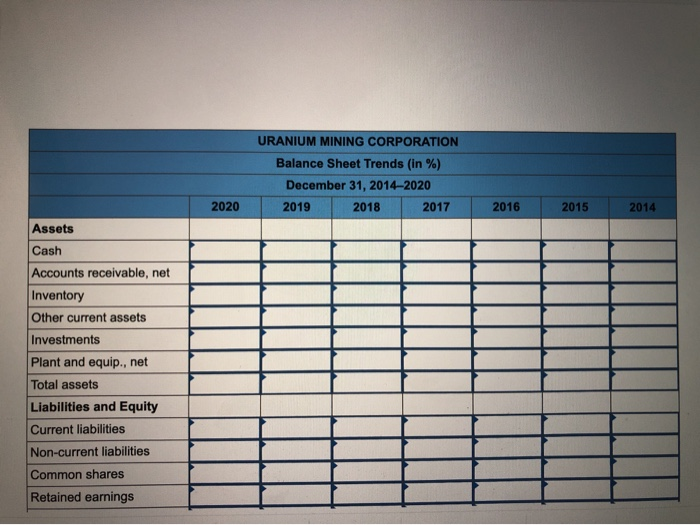
Net sales Cost of goods sold Gross profit from sales Operating expenses Profit Uranium Mining Corporation Income Statement ($000) For Years Ended December 31 2020 2019 2018 2017 $1,317 $1,198 $1,122 $1,058 778 649 5 71 511 $ 539 $ 549 $ 551 $ 547 294 250 237 198 $ 245 $ 299 $ 314 $ 349 2016 $1,012 481 $ 531 184 $ 347 2015 $966 456 $510 182 $328 2014 $ 864 390 $ 474 168 $306 Uranium Mining Corporation Balance Sheet ($000) December 31 2020 2019 2018 2017 2016 2015 2014 $ $ $ 59 324 1,097 $ 71 338 812 73 310 74 246 613 716 46 Assets Cash Accounts receivable, net Inventory Other current assets Non-strategic investments Plant and equipment, net Total assets Liabilities and Equity Current liabilities Non-current liabilities Common shares Retained earnings $ 77 221 556 41 118 827 $1,840 $ 76 211 480 41 118 756 $1,682 $ 78 158 366 30 118 674 $1.424 0 1,452 $ 2,978 1,448 $2,712 1,291 $ 2, 422 118 806 $1,901 $ 290 $ 708 752 930 588 599 660 930 523 407 643 930 442 344 318 802 437 304 324 802 410 348 670 374 199 274 670 281 GULD 930 930 INUPUULLO Common shares Retained earnings Total liabilities and equity 930 588 802 670 442 523 $2,712 670 374 $1,682 281 $2,978 410 $1,840 $2,422 S1.901 $1,424 Required: Calculate trend percentages for the items of the statements using 2014 as the base year. (Round your decimal place.) URANIUM MINING CORPORATION Income Statement Trends (in %) For Years Ended December 31, 2014-2020 2020 2019 2018 2017 2016 2015 2014 Net sales Cost of goods sold Gross profit Operating expenses Profit URANIUM MINING CORPORATION Balance Sheet Trends (in %) December 31, 2014-2020 2019 2018 2017 2020 2016 2015 2014 Assets Cash Accounts receivable, net Inventory Other current assets Investments Plant and equip., net Total assets Liabilities and Equity Current liabilities Non-current liabilities Common shares Retained earnings