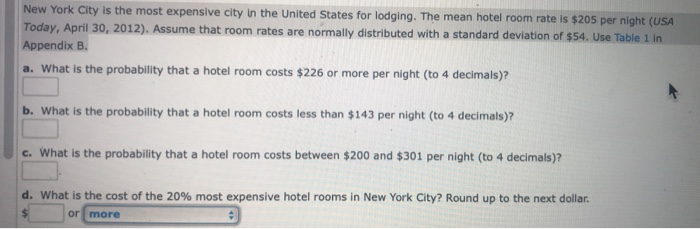
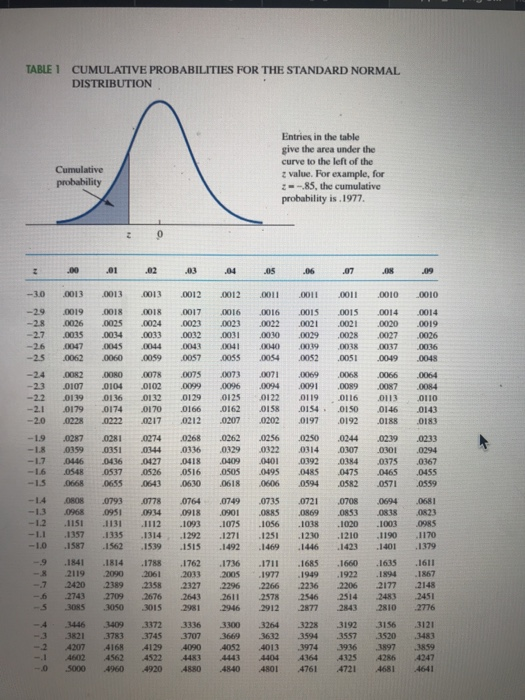
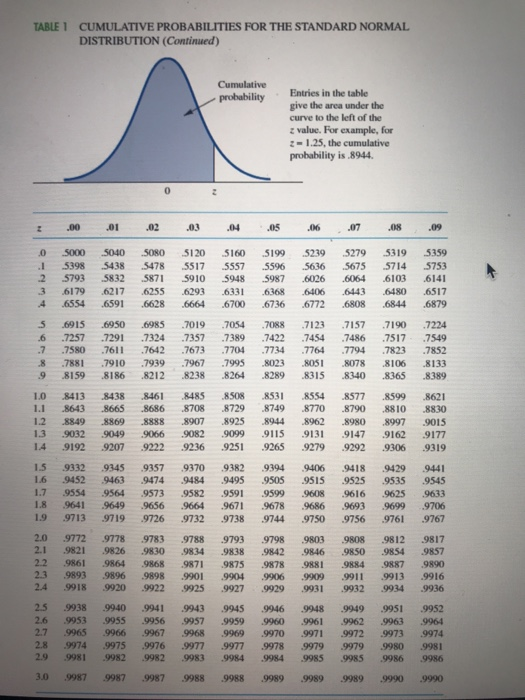
New York City is the most expensive city in the United States for lodging. The mean hotel room rate is $205 per night (USA Today, April 30, 2012). Assume that room rates are normally distributed with a standard deviation of $54. Use Table 1 in Appendix B. a. What is the probability that a hotel room costs $226 or more per night (to 4 decimals)? b. What is the probability that a hotel room costs less than $143 per night (to 4 decimals)? c. What is the probability that a hotel room costs between $200 and $301 per night (to 4 decimals)? d. What is the cost of the 20% most expensive hotel rooms in New York City? Round up to the next dollar. or more TABLE 1 CUMULATIVE PROBABILITIES FOR THE STANDARD NORMAL DISTRIBUTION Cumulative probability Entries in the table give the area under the curve to the left of the z value. For example, for 2 = -85, the cumulative probability is 1977 2 2 .00 .01 .02 .03 .04 .05 .06 .07 .08 .09 .0013 .0013 .0012 0012 0011 0011 0011 0010 0010 -3.0 -29 -28 -27 -26 -25 .0013 .0019 .0026 ,0035 .0047 .0062 .0018 .0024 .0033 0044 .0059 0016 .0022 .0030 040 .0015 .0021 .0028 0038 .0051 .0014 .0020 .0027 0037 .0049 .0014 .0019 .0026 .0036 .0048 0054 .0018 .0025 0034 0045 .0060 CORO 20104 0136 0174 0222 0017 .0023 .0032 0043 .0057 .0075 .0099 .0129 0166 .0212 -24 -23 0015 0021 0029 0039 .0052 0069 .0091 0119 0154 ,0197 -22 OOR 2 .0107 0139 0179 0228 0016 0023 0031 0041 .0055 0073 .0096 0125 0162 .0207 0262 0329 .0409 OSOS .0078 0102 .0132 0170 0217 .0071 0094 0122 0158 .0202 0066 .0087 0113 01-46 0188 .0064 .0084 0110 .0143 0183 -2.1 -2.0 .0068 .0089 0116 .0150 .0192 .0244 .0307 .0384 .0475 .0582 -1.9 -1.8 -1.7 -1.6 -1.5 0287 0359 0446 .0548 0668 .0281 0351 0436 0537 0655 .0274 ,0344 .0427 0526 .0643 .0268 .0336 .0418 0516 .0630 .0256 0322 0401 0495 .0606 .0250 0314 .0392 .0485 0594 0233 0294 .0367 .0455 0618 0559 .0239 0301 .0375 .0465 .0571 0694 OR 18 1003 1190 1401 -1.3 -1.2 .0793 .0951 OSOS 0968 1151 .1357 1587 .0778 .0934 1112 .0764 0918 .1093 .0735 0885 1056 .1251 .1469 .0721 0869 .1038 .12.30 .1446 .0708 .0853 1020 .1210 .1423 .1292 -1.0 1515 .0749 0901 1075 .1271 .1492 .1736 2005 2296 2611 2946 .1335 1562 .1814 2090 2389 2709 3050 - .0681 0823 0985 1170 1379 1611 1867 2148 2451 2776 .1841 2119 2420 2743 3085 .1539 .1788 2061 2358 2676 3015 3372 3745 4129 4522 .4920 .1762 2033 2327 2643 2981 .1711 1977 2266 2578 2912 .1685 .1949 2236 2546 2877 .1660 .1922 2206 2514 .1635 1894 2177 2483 2810 3156 3520 3897 4286 4681 3300 3409 3783 4168 3707 3264 3632 4013 3228 3594 .3974 3192 .3557 3936 3821 4207 4602 5000 3121 3483 .3859 -.0 4960 4880 4801 4761 4721 4641 TABLE 1 CUMULATIVE PROBABILITIES FOR THE STANDARD NORMAL DISTRIBUTION (Continued) Cumulative probability Entries in the table give the area under the curve to the left of the z value. For example, for 2 -1.25, the cumulative probability is .8944 0 2 .00 .01 .02 .03 .04 .05 .06 .07 .08 .09 0 .1 2 .3 4 5000 5398 5793 .6179 .6554 .5040 .5438 .5832 .6217 .6591 SORO 5478 .5871 .6255 .6628 5120 5517 5910 .6293 .6664 5160 5557 5948 .6331 .6700 5199 5596 5987 .6368 .6736 .5239 .5636 .6026 .6406 .6772 5279 .5675 .6064 .6443 .6808 5319 5714 .6103 .6480 .6844 5359 5753 .6141 6517 .6879 .7054 5 .6 .7 .7389 6915 .7257 .7580 .7881 8159 .6950 .7291 .7611 .7910 .8186 .6985 .7324 .7642 .7939 .8212 .7019 .7357 .7673 .7967 .8238 .7704 .7995 .8264 .7088 .7422 .7734 .8023 .8289 .7123 .7454 .7764 805! .8315 .7157 .7486 .7794 .8078 .8340 .7190 .7517 .7823 .8106 .8365 .7224 .7549 .7852 .8133 .8389 1.0 1.1 1.2 1.3 1.4 .8413 .8643 .8849 9032 .9192 .8438 .8665 .8869 9049 9207 .8461 .8686 .8888 9066 .9222 .8485 .8708 .8907 .9082 .9236 .8508 .8729 .8925 .9099 .9251 .8531 .8749 .8944 .9115 .9265 .8554 8770 .8962 .9131 .9279 .8577 .8790 .8980 .9147 .9292 .8599 .8810 .8997 .9162 .9306 .8621 .8830 .9015 .9177 .9319 9441 1.5 1.6 1.7 1.8 1.9 9332 9452 .9554 9641 9713 9345 9463 .9564 .9649 .9719 .9357 .9474 .9573 .9656 .9726 9370 9484 .9582 .9664 .9732 9382 .9495 .9591 9671 .9738 .9394 .9505 .9599 .9678 .9744 9406 .9515 .9608 .9686 .9750 .9418 .9525 .9616 .9693 .9756 .9429 .9535 9625 .9699 .9761 .9545 .9633 .9706 .9767 .9793 2.0 2.1 2.2 2.3 2.4 .9772 .9821 9861 9893 9918 .9778 .9826 9864 .9896 9920 9783 .9830 .9868 9898 .9922 .9788 .9834 .9871 .9901 9925 .9838 9875 9904 .9927 .9798 .9842 .9878 .9906 .9929 .9803 .9846 .9881 .9909 .9931 .9808 9850 .9884 .9911 .9932 9812 .9854 .9887 .9913 .9934 .9817 .9857 .9890 .9916 .9936 2.5 2.6 2.7 2.8 2.9 .9938 .9953 .9965 .9974 9981 .9940 .9955 .9966 .9975 .9982 .9941 .9956 9967 .9976 9982 .9943 .9957 9968 .9977 .9983 .9945 .9959 .9969 .9977 .9984 .9946 9960 .9970 .9978 .9984 .9948 .9961 .9971 9979 .9985 .9949 .9962 .9972 .9979 .9985 .9951 .9963 .9973 9980 .9986 .9952 9964 9974 .9981 9986 3.0 .9987 9987 9987 .9988 .9988 .9989 .9989 9989 .9990 .9990