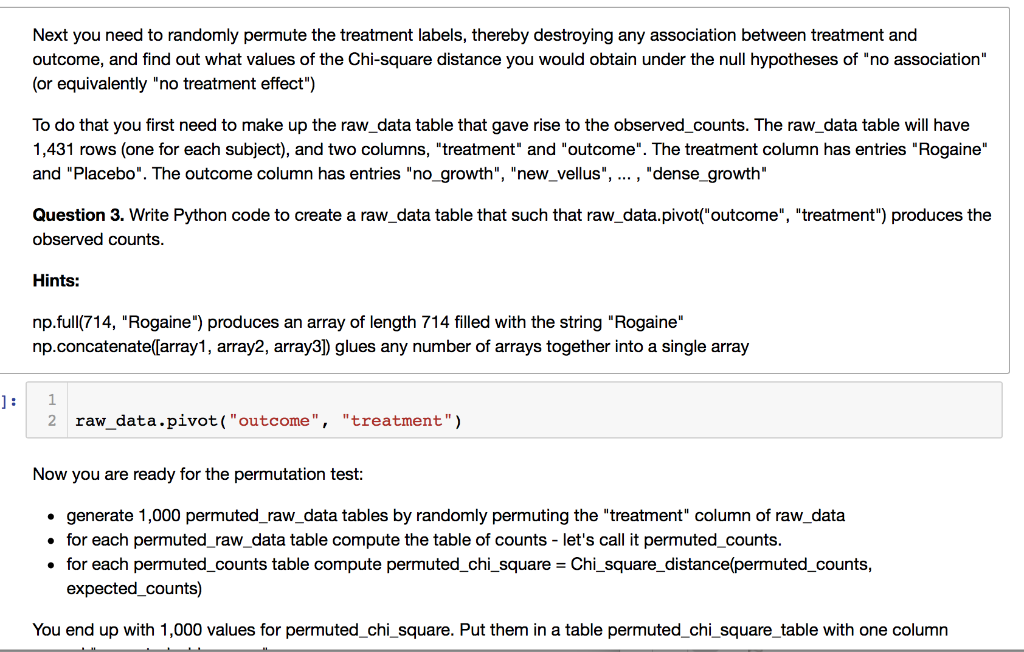
Next you need to randomly permute the treatment labels, thereby destroying any association between treatment and outcome, and find out what values of the Chi-square distance you would obtain under the null hypotheses of "no association" (or equivalently "no treatment effect") To do that you first need to make up the raw_data table that gave rise to the observed_counts. The raw_data table will have 1,431 rows (one for each subject), and two columns, "treatment" and "outcome". The treatment column has entries "Rogaine" and "Placebo". The outcome column has entries "no_growth", "new_vellus", ... , "dense_growth" Question 3. Write Python code to create a raw_data table that such that raw_data.pivot("outcome", "treatment") produces the observed counts. Hints: np.full(714, "Rogaine") produces an array of length 714 filled with the string "Rogaine" np.concatenate([array1, array2, array3]) glues any number of arrays together into a single array 1 2 raw_data.pivot("outcome", "treatment") Now you are ready for the permutation test: generate 1,000 permuted_raw_data tables by randomly permuting the "treatment" column of raw data for each permuted_raw_data table compute the table of counts - let's call it permuted_counts. for each permuted_counts table compute permuted_chi_square = Chi_square_distance(permuted_counts, expected_counts) You end up with 1,000 values for permuted_chi_square. Put them in a table permuted_chi_square_table with one column Next you need to randomly permute the treatment labels, thereby destroying any association between treatment and outcome, and find out what values of the Chi-square distance you would obtain under the null hypotheses of "no association" (or equivalently "no treatment effect") To do that you first need to make up the raw_data table that gave rise to the observed_counts. The raw_data table will have 1,431 rows (one for each subject), and two columns, "treatment" and "outcome". The treatment column has entries "Rogaine" and "Placebo". The outcome column has entries "no_growth", "new_vellus", ... , "dense_growth" Question 3. Write Python code to create a raw_data table that such that raw_data.pivot("outcome", "treatment") produces the observed counts. Hints: np.full(714, "Rogaine") produces an array of length 714 filled with the string "Rogaine" np.concatenate([array1, array2, array3]) glues any number of arrays together into a single array 1 2 raw_data.pivot("outcome", "treatment") Now you are ready for the permutation test: generate 1,000 permuted_raw_data tables by randomly permuting the "treatment" column of raw data for each permuted_raw_data table compute the table of counts - let's call it permuted_counts. for each permuted_counts table compute permuted_chi_square = Chi_square_distance(permuted_counts, expected_counts) You end up with 1,000 values for permuted_chi_square. Put them in a table permuted_chi_square_table with one column