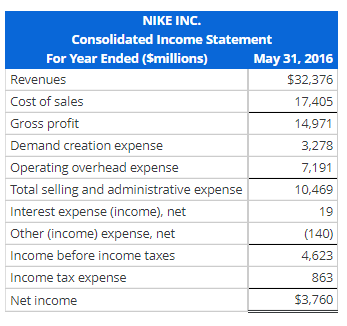
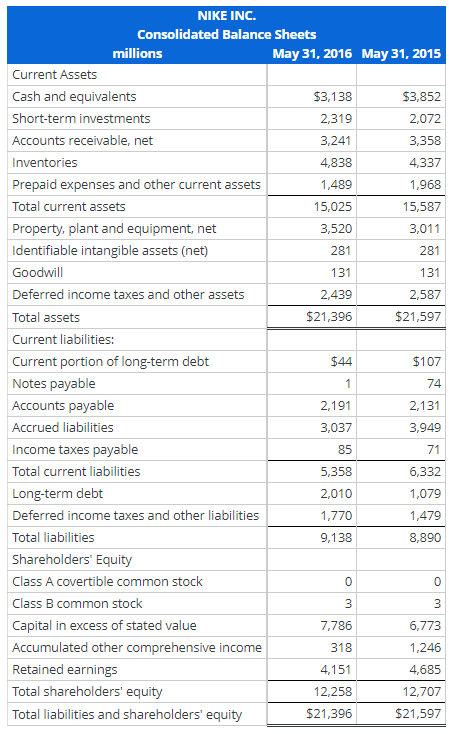
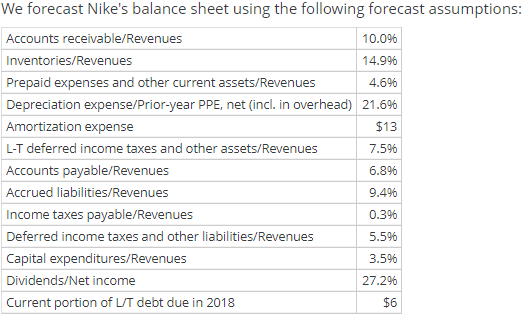
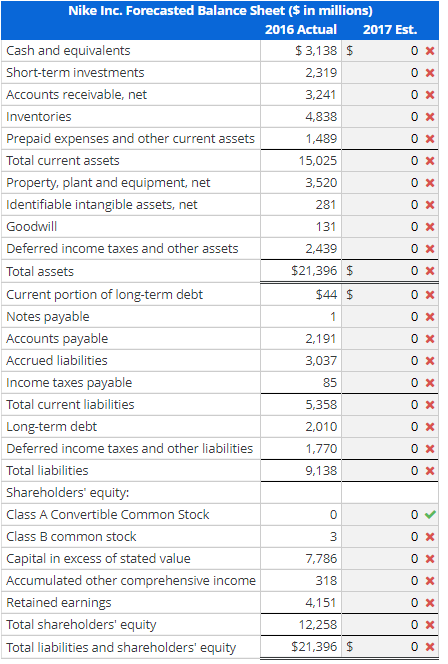
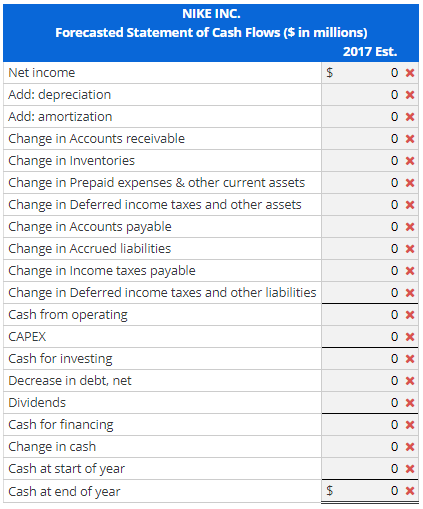
NIKE INC. Consolidated Income Statement For Year Ended ($millions) May 31, 2016 Revenues $32,376 Cost of sales 17,405 Gross profit 14,971 Demand creation expense 3,278 Operating overhead expense 7,191 Total selling and administrative expense 10,469 Interest expense (income), net 19 Other (income) expense, net (140) Income before income taxes 4,623 Income tax expense 863 Net income $3,760 NIKE INC. Consolidated Balance Sheets millions May 31, 2016 May 31, 2015 Current Assets Cash and equivalents $3,138 $3,852 Short-term investments 2,319 2,072 Accounts receivable, net 3,241 3,358 Inventories 4,838 4,337 Prepaid expenses and other current assets 1,489 1,968 Total current assets 15,025 15,587 Property, plant and equipment, net 3,520 3,011 Identifiable intangible assets (net) 281 281 Goodwill 131 131 Deferred income taxes and other assets 2,439 2,587 Total assets $21,396 $21,597 Current liabilities: Current portion of long-term debt $44 $107 Notes payable 74 Accounts payable 2,191 2,131 Accrued liabilities 3,037 3,949 Income taxes payable 85 71 Total current liabilities 5,358 6,332 Long-term debt 2,010 1,079 Deferred income taxes and other liabilities 1,770 1,479 Total liabilities 9,138 8,890 Shareholders' Equity Class A covertible common stock 0 Class B common stock Capital in excess of stated value 7,786 6,773 Accumulated other comprehensive income 318 1,246 Retained earnings 4,151 4,685 Total shareholders' equity 12,258 12,707 Total liabilities and shareholders' equity $21,396 $21,597 1 0 3 3 We forecast Nike's balance sheet using the following forecast assumptions: Accounts receivable/Revenues 10.096 Inventories/Revenues 14.996 Prepaid expenses and other current assets/Revenues 4.696 Depreciation expense/Prior-year PPE, net (incl. in overhead) 21.6% Amortization expense $13 L-T deferred income taxes and other assets/Revenues 7.596 Accounts payable/Revenues 6.896 Accrued liabilities/Revenues 9.496 Income taxes payable/Revenues 0.396 Deferred income taxes and other liabilities/Revenues 5.596 Capital expenditures/Revenues 3.596 Dividends/Net income 27.296 Current portion of LIT debt due in 2018 $6 0 x 1 Nike Inc. Forecasted Balance Sheet ($ in millions) 2016 Actual 2017 Est. Cash and equivalents $3,138 $ 0X Short-term investments 2,319 OX Accounts receivable, net 3,241 Inventories 4,838 OX Prepaid expenses and other current assets 1,489 OX Total current assets 15,025 0 x Property, plant and equipment, net 3,520 0X Identifiable intangible assets, net 281 OX Goodwill 131 OX Deferred income taxes and other assets 2,439 Total assets $21,396 $ OX Current portion of long-term debt $44 $ Notes payable 0X Accounts payable 2,191 OX Accrued liabilities 3,037 OX Income taxes payable 85 OX Total current liabilities 5,358 OX Long-term debt 2,010 OX Deferred income taxes and other liabilities 1,770 OX Total liabilities 9,138 OX Shareholders' equity: Class A Convertible Common Stock 0 Class B common stock 3 OX Capital in excess of stated value 7,786 OX Accumulated other comprehensive income 318 Ox Retained earnings 4,151 OX Total shareholders' equity 12,258 0 x Total liabilities and shareholders' equity $21,396 $ OX 0 A 0 x 0 x 0 X 0 X NIKE INC. Forecasted Statement of Cash Flows ($ in millions) 2017 Est. Net income OX Add: depreciation Add: amortization 0x Change in Accounts receivable 0 X Change in Inventories 0X Change in Prepaid expenses & other current assets Change in Deferred income taxes and other assets OX Change in Accounts payable Change in Accrued liabilities Change in Income taxes payable Change in Deferred income taxes and other liabilities Cash from operating Ox CAPEX Cash for investing Decrease in debt, net Dividends OX Cash for financing Change in cash Cash at start of year Cash at end of year 0 X 0 x 0 X 0 X 0 X 0 X 0X OX $ 0 X NIKE INC. Consolidated Income Statement For Year Ended ($millions) May 31, 2016 Revenues $32,376 Cost of sales 17,405 Gross profit 14,971 Demand creation expense 3,278 Operating overhead expense 7,191 Total selling and administrative expense 10,469 Interest expense (income), net 19 Other (income) expense, net (140) Income before income taxes 4,623 Income tax expense 863 Net income $3,760 NIKE INC. Consolidated Balance Sheets millions May 31, 2016 May 31, 2015 Current Assets Cash and equivalents $3,138 $3,852 Short-term investments 2,319 2,072 Accounts receivable, net 3,241 3,358 Inventories 4,838 4,337 Prepaid expenses and other current assets 1,489 1,968 Total current assets 15,025 15,587 Property, plant and equipment, net 3,520 3,011 Identifiable intangible assets (net) 281 281 Goodwill 131 131 Deferred income taxes and other assets 2,439 2,587 Total assets $21,396 $21,597 Current liabilities: Current portion of long-term debt $44 $107 Notes payable 74 Accounts payable 2,191 2,131 Accrued liabilities 3,037 3,949 Income taxes payable 85 71 Total current liabilities 5,358 6,332 Long-term debt 2,010 1,079 Deferred income taxes and other liabilities 1,770 1,479 Total liabilities 9,138 8,890 Shareholders' Equity Class A covertible common stock 0 Class B common stock Capital in excess of stated value 7,786 6,773 Accumulated other comprehensive income 318 1,246 Retained earnings 4,151 4,685 Total shareholders' equity 12,258 12,707 Total liabilities and shareholders' equity $21,396 $21,597 1 0 3 3 We forecast Nike's balance sheet using the following forecast assumptions: Accounts receivable/Revenues 10.096 Inventories/Revenues 14.996 Prepaid expenses and other current assets/Revenues 4.696 Depreciation expense/Prior-year PPE, net (incl. in overhead) 21.6% Amortization expense $13 L-T deferred income taxes and other assets/Revenues 7.596 Accounts payable/Revenues 6.896 Accrued liabilities/Revenues 9.496 Income taxes payable/Revenues 0.396 Deferred income taxes and other liabilities/Revenues 5.596 Capital expenditures/Revenues 3.596 Dividends/Net income 27.296 Current portion of LIT debt due in 2018 $6 0 x 1 Nike Inc. Forecasted Balance Sheet ($ in millions) 2016 Actual 2017 Est. Cash and equivalents $3,138 $ 0X Short-term investments 2,319 OX Accounts receivable, net 3,241 Inventories 4,838 OX Prepaid expenses and other current assets 1,489 OX Total current assets 15,025 0 x Property, plant and equipment, net 3,520 0X Identifiable intangible assets, net 281 OX Goodwill 131 OX Deferred income taxes and other assets 2,439 Total assets $21,396 $ OX Current portion of long-term debt $44 $ Notes payable 0X Accounts payable 2,191 OX Accrued liabilities 3,037 OX Income taxes payable 85 OX Total current liabilities 5,358 OX Long-term debt 2,010 OX Deferred income taxes and other liabilities 1,770 OX Total liabilities 9,138 OX Shareholders' equity: Class A Convertible Common Stock 0 Class B common stock 3 OX Capital in excess of stated value 7,786 OX Accumulated other comprehensive income 318 Ox Retained earnings 4,151 OX Total shareholders' equity 12,258 0 x Total liabilities and shareholders' equity $21,396 $ OX 0 A 0 x 0 x 0 X 0 X NIKE INC. Forecasted Statement of Cash Flows ($ in millions) 2017 Est. Net income OX Add: depreciation Add: amortization 0x Change in Accounts receivable 0 X Change in Inventories 0X Change in Prepaid expenses & other current assets Change in Deferred income taxes and other assets OX Change in Accounts payable Change in Accrued liabilities Change in Income taxes payable Change in Deferred income taxes and other liabilities Cash from operating Ox CAPEX Cash for investing Decrease in debt, net Dividends OX Cash for financing Change in cash Cash at start of year Cash at end of year 0 X 0 x 0 X 0 X 0 X 0 X 0X OX $ 0 X


