Nike Inc. is a well-known brand that many customers are loyal to. For this reason, many persons may consider investing in Nike Inc. due to its popularity. Look at the financial summary below and analyze the performance of Nike Inc. between the years 2016 2020 using the following ratios (most ratios are already calculated but two are not):
- Gross Profit Margin
- Net Profit Margin
- Current Ratio
- Inventory Turnover
- Debt Ratio (hint: Total Liabilities = Total Assets Total Equity)
- Return on Equity
- Return on Assets
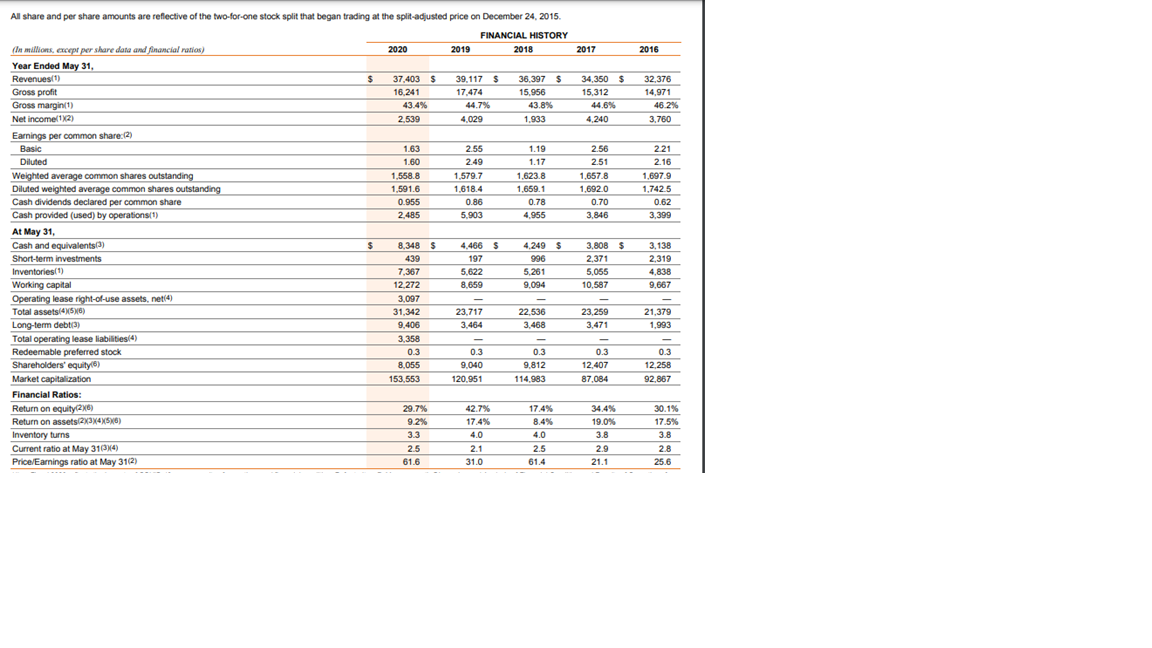
2017 2016 34,350 $ 15,312 44.6% 32.376 14,971 46.2% 3.760 4,240 2.56 2.51 1.657.8 1,692.0 0.70 3,846 221 2.16 1.6979 1,7425 0.62 3.399 All share and per share amounts are reflective of the two-for-one stock split that began trading at the split-adjusted price on December 24, 2015 . FINANCIAL HISTORY (In millions, except per share data and financial ratios) 2020 2019 2018 Year Ended May 31, Revenuest) $ 37,403 $ 39. 117 $ 36.397 $ Gross profit 16 241 17,474 15.956 Gross marginit) 43.4% 44.7% 43.8% Net Income 1/2) 2,539 4,029 1.933 Earnings per common share:12) Basic 1.63 2.55 1.19 Diluted 1.60 2.49 1.17 Weighted average common shares outstanding 1.558.8 1.579.7 1,623.8 Diluted weighted average common shares outstanding 1,591.6 1.618.4 1.659.1 Cash dividends declared per common share 0.955 0.86 0.78 Cash provided (used) by operations (1) 2.485 5.903 4.955 At May 31, Cash and equivalents/3) $ 8.348 5 4,466 $ 4.249 $ Short-term investments 197 996 Inventories(1) 7,367 5.622 5.261 Working capital 12.272 8.659 9,094 Operating lease right-of-use assets, net(4) 3,097 Total assets/456) 31,342 23.717 22.536 Long-term debt (3) 9.406 3,464 3,468 Total operating lease liabilities/4) 3,358 Redeemable preferred stock 0.3 0.3 0.3 Shareholders' equity (6) 8,055 9.040 9.812 Market capitalization 153.553 120.951 114,983 Financial Ratios Return on equity(20) 29.7% 42.7% 17.4% Return on assets 2X34X576) 9.2% 17.4% 8.4% Inventory turns 3.3 4.0 4.0 Current ratio at May 31(34) 2.5 2.1 2.5 Price/Earnings ratio at May 31(2) 61.6 31.0 61.4 439 3.808 $ 2.37 5,055 10.587 3,138 2.319 4,838 9.667 23,259 3.471 21,379 1.993 0.3 12,407 87,084 0.3 12 258 92.867 34.4% 19.0% 3.8 2.9 30.1% 17.5% 3.8 2.8 25.6 21.1 2017 2016 34,350 $ 15,312 44.6% 32.376 14,971 46.2% 3.760 4,240 2.56 2.51 1.657.8 1,692.0 0.70 3,846 221 2.16 1.6979 1,7425 0.62 3.399 All share and per share amounts are reflective of the two-for-one stock split that began trading at the split-adjusted price on December 24, 2015 . FINANCIAL HISTORY (In millions, except per share data and financial ratios) 2020 2019 2018 Year Ended May 31, Revenuest) $ 37,403 $ 39. 117 $ 36.397 $ Gross profit 16 241 17,474 15.956 Gross marginit) 43.4% 44.7% 43.8% Net Income 1/2) 2,539 4,029 1.933 Earnings per common share:12) Basic 1.63 2.55 1.19 Diluted 1.60 2.49 1.17 Weighted average common shares outstanding 1.558.8 1.579.7 1,623.8 Diluted weighted average common shares outstanding 1,591.6 1.618.4 1.659.1 Cash dividends declared per common share 0.955 0.86 0.78 Cash provided (used) by operations (1) 2.485 5.903 4.955 At May 31, Cash and equivalents/3) $ 8.348 5 4,466 $ 4.249 $ Short-term investments 197 996 Inventories(1) 7,367 5.622 5.261 Working capital 12.272 8.659 9,094 Operating lease right-of-use assets, net(4) 3,097 Total assets/456) 31,342 23.717 22.536 Long-term debt (3) 9.406 3,464 3,468 Total operating lease liabilities/4) 3,358 Redeemable preferred stock 0.3 0.3 0.3 Shareholders' equity (6) 8,055 9.040 9.812 Market capitalization 153.553 120.951 114,983 Financial Ratios Return on equity(20) 29.7% 42.7% 17.4% Return on assets 2X34X576) 9.2% 17.4% 8.4% Inventory turns 3.3 4.0 4.0 Current ratio at May 31(34) 2.5 2.1 2.5 Price/Earnings ratio at May 31(2) 61.6 31.0 61.4 439 3.808 $ 2.37 5,055 10.587 3,138 2.319 4,838 9.667 23,259 3.471 21,379 1.993 0.3 12,407 87,084 0.3 12 258 92.867 34.4% 19.0% 3.8 2.9 30.1% 17.5% 3.8 2.8 25.6 2