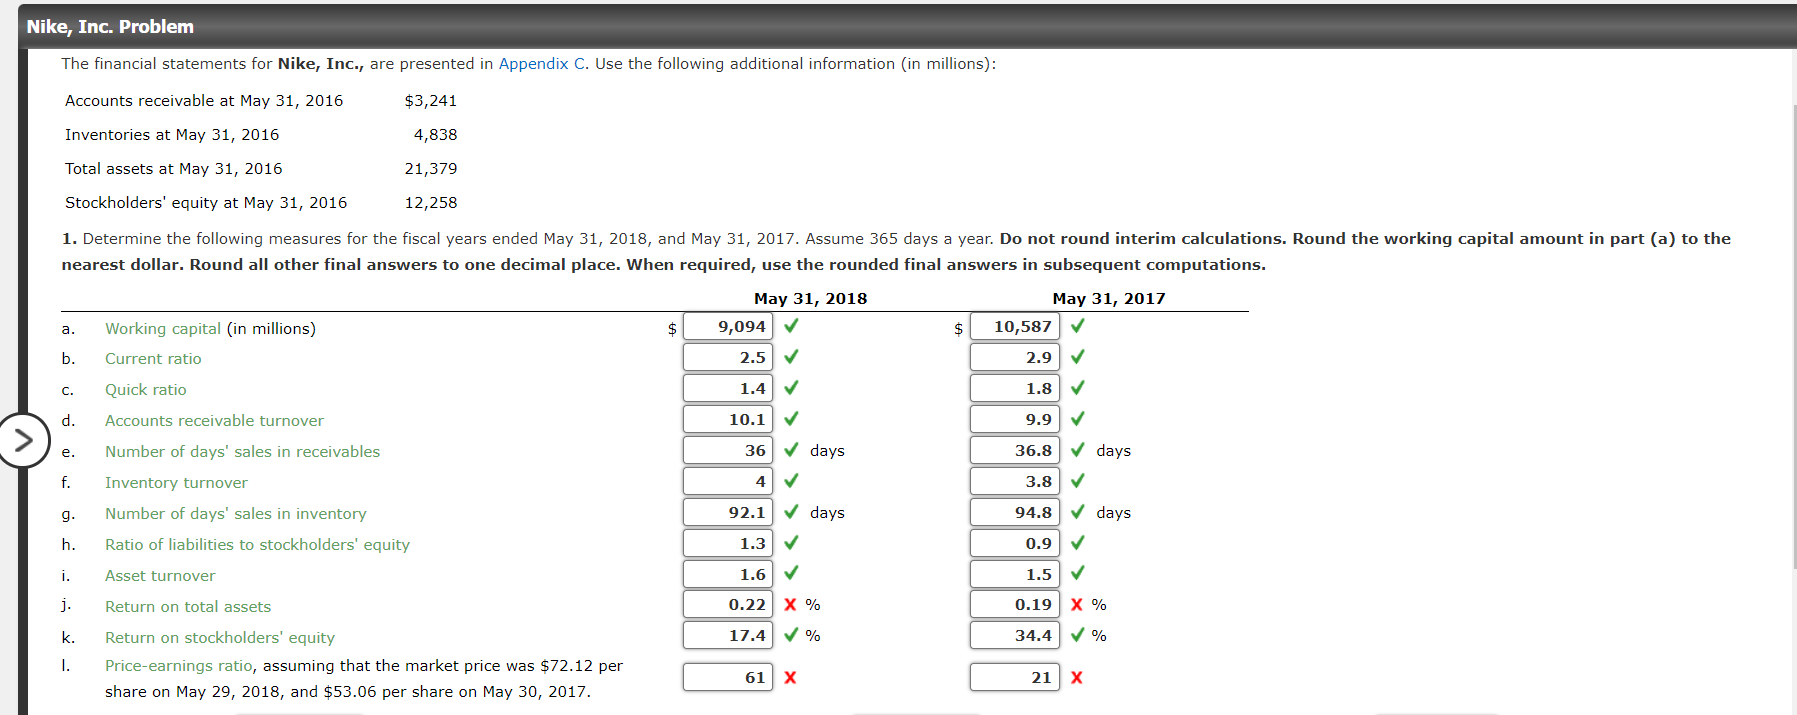
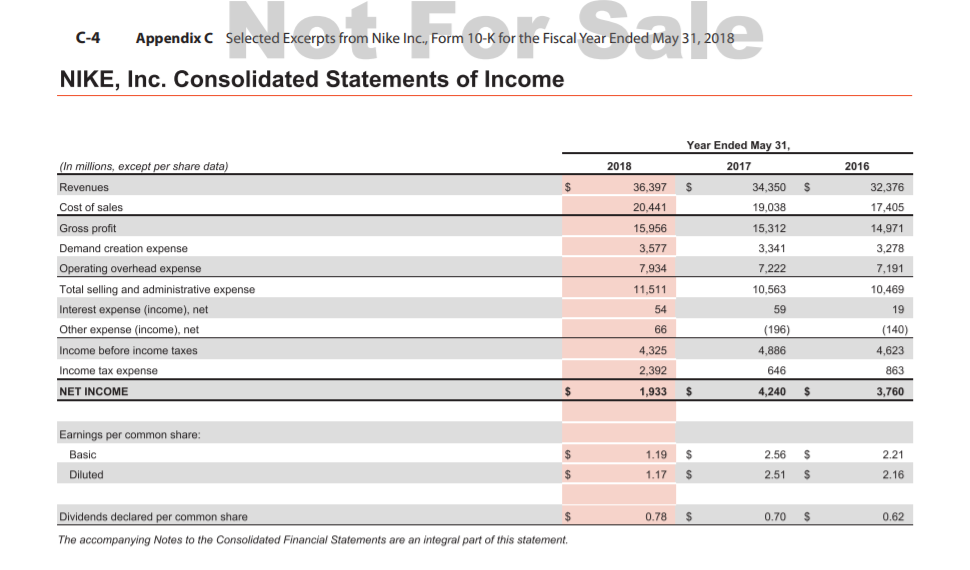
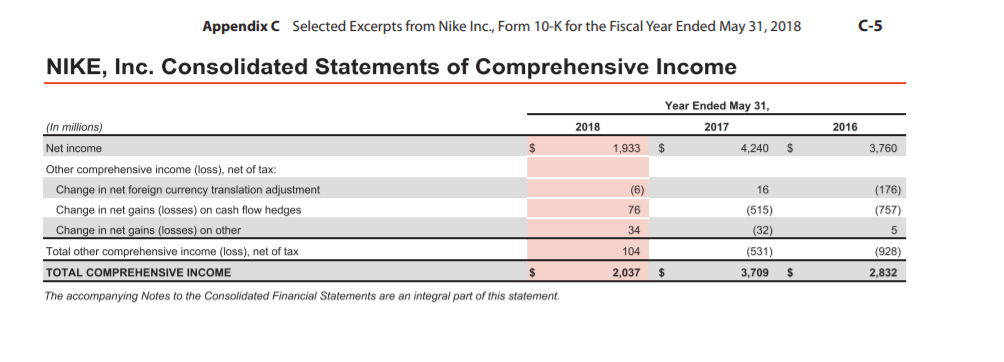
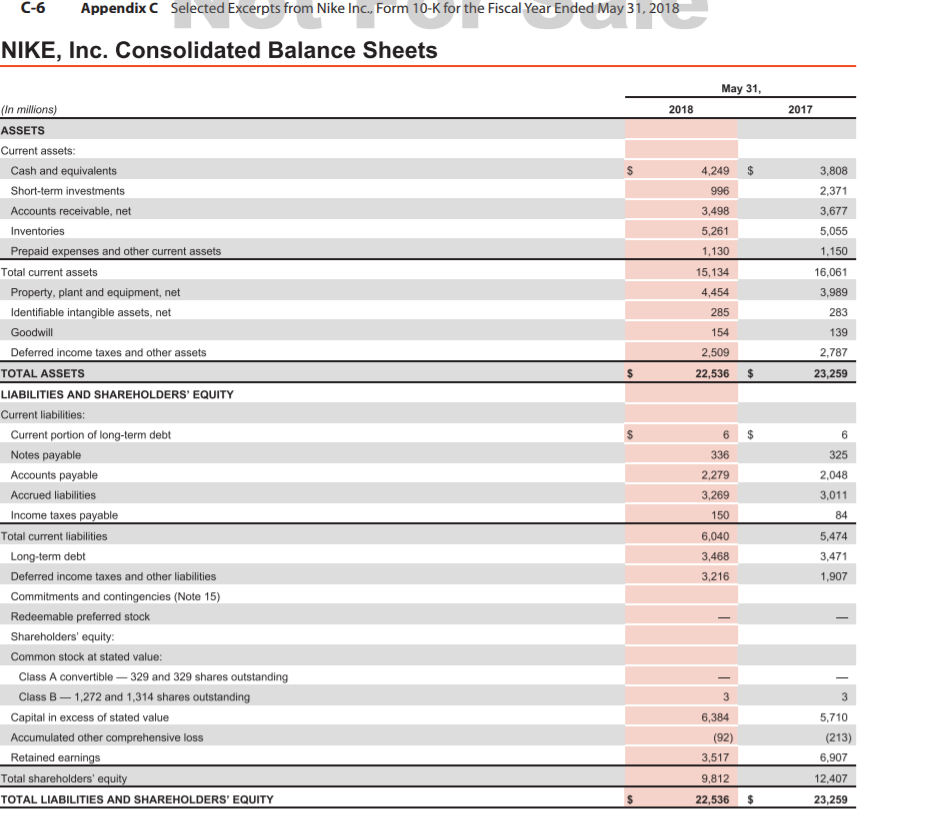
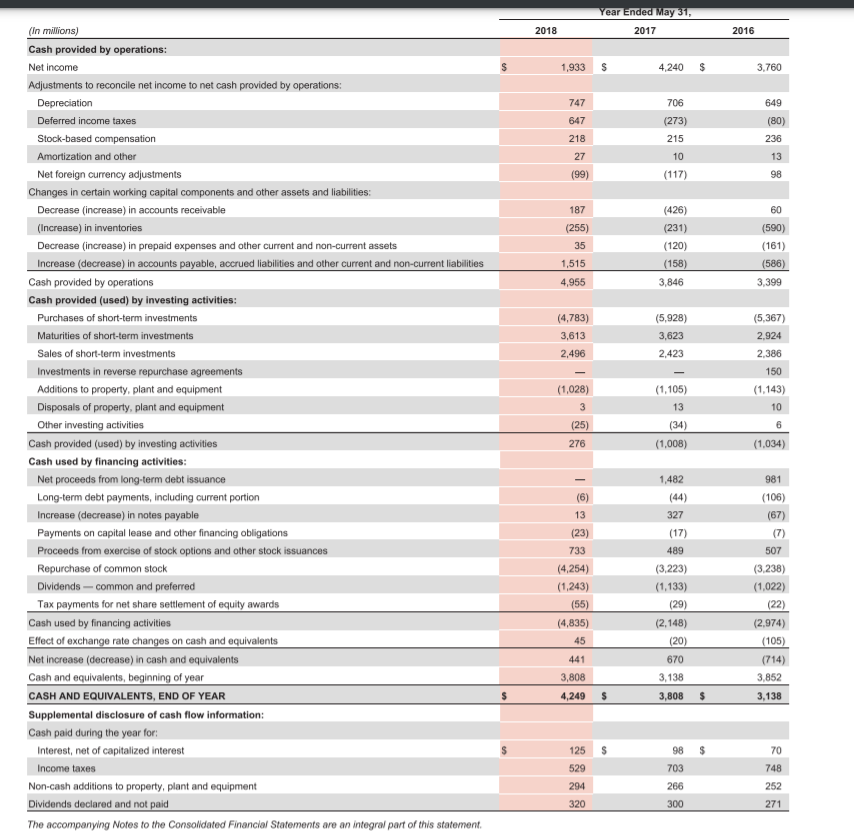
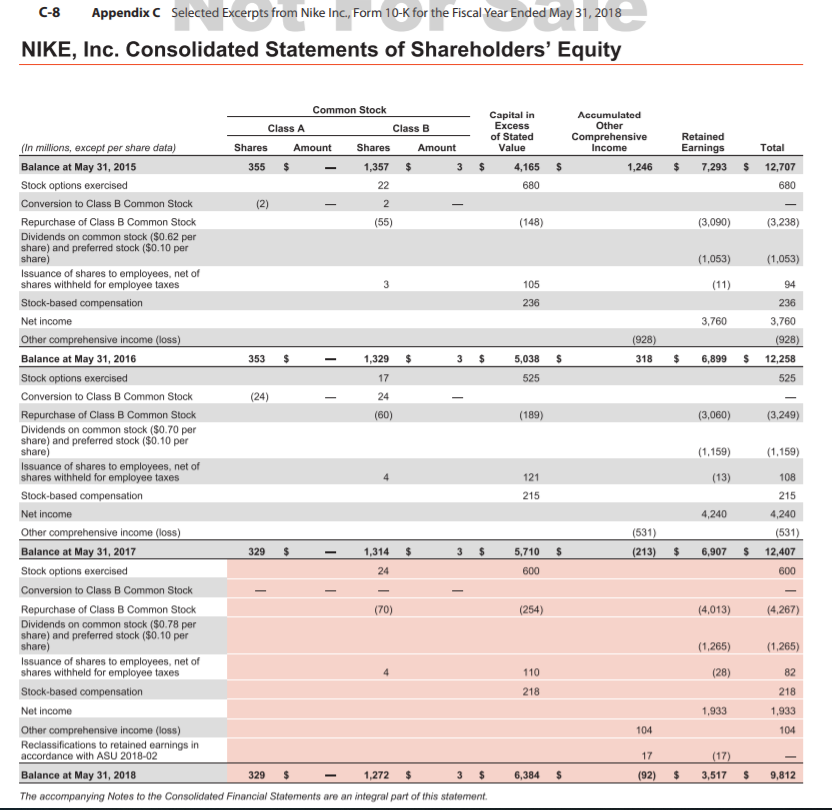
Nike, Inc. Problem The financial statements for Nike, Inc., are presented in Appendix C. Use the following additional information (in millions): $3,241 Accounts receivable at May 31, 2016 Inventories at May 31, 2016 Total assets at May 31, 2016 4,838 21,379 Stockholders' equity at May 31, 2016 12,258 1. Determine the following measures for the fiscal years ended May 31, 2018, and May 31, 2017. Assume 365 days a year. Do not round interim calculations. Round the working capital amount in part (a) to the nearest dollar. Round all other final answers to one decimal place. When required, use the rounded final answers in subsequent computations. May 31, 2018 9,094 a. Working capital (in millions) $ $ May 31, 2017 10,587 2.9 b. Current ratio 2.5 C. Quick ratio 1.4 1.8 d. Accounts receivable turnover 10.1 9.9 e. 36 days 36.8 days Number of days' sales in receivables Inventory turnover f. 4 3.8 g. 92.1 days 94.8 days Number of days' sales in inventory Ratio of liabilities to stockholders' equity h. 1.3 0.9 i. Asset turnover 1.6 1.5 j. Return on total assets 0.22 X % 0.19 X % 17.4 % 34.4 % k. 1. Return on stockholders' equity Price-earnings ratio, assuming that the market price was $72.12 per share on May 29, 2018, and $53.06 per share on May 30, 2017. 61 21 C-4 Appendix C Selected Excerpts from Nike Inc., Form 10-K for the Fiscal Year Ended May 31, 2018 . NIKE, Inc. Consolidated Statements of Income (In millions, except per share data) 2018 2016 Year Ended May 31, 2017 $ 34,350 $ 19,038 $ 36,397 Revenues Cost of sales 32,376 17,405 20,441 15,956 15,312 14,971 3,577 3,341 3,278 7,191 7,934 7,222 11,511 10,563 10,469 Gross profit Demand creation expense Operating overhead expense Total selling and administrative expense Interest expense (income), net Other expense (income), net Income before income taxes Income tax expense NET INCOME 59 19 (196) (140) 54 66 4,325 2,392 1,933 $ 4.886 4,623 646 863 3,760 4,240 $ Earnings per common share: : Basic Diluted 1.19 $ 2.56 $ 2.21 $ 1.17 $ 2.51 s 2.16 0.78 $ $ 0.70 $ 0.62 Dividends declared per common share The accompanying Notes to the Consolidated Financial Statements are an integral part of this statement. Appendix C Selected Excerpts from Nike Inc., Form 10-K for the Fiscal Year Ended May 31, 2018 C-5 NIKE, Inc. Consolidated Statements of Comprehensive Income Year Ended May 31, (in millions) 2018 2017 2016 Net income 1,933 4,240 $ 3,760 (6) 16 (176) 76 (515) (757) Other comprehensive income (loss), net of tax: Change in net foreign currency translation adjustment Change in net gains (losses) on cash flow hedges Change in net gains (losses) on other Total other comprehensive income (loss), net of tax TOTAL COMPREHENSIVE INCOME 34 (32) 5 104 (531) (928) 2,037 $ 3,709 $ 2,832 The accompanying Notes to the Consolidated Financial Statements are an integral part of this statement. C-6 Appendix C Selected Excerpts from Nike Inc., Form 10-K for the Fiscal Year Ended May 31, 2018 NIKE, Inc. Consolidated Balance Sheets May 31, 2018 2017 4,249 $ 996 3,498 5,261 1,130 15,134 4,454 3,808 2,371 3,677 5,055 1,150 16,061 3,989 283 139 2,787 23,259 285 154 2.509 $ 22,536 $ (In millions) ASSETS Current assets: Cash and equivalents Short-term investments Accounts receivable, net Inventories Prepaid expenses and other current assets Total current assets Property, plant and equipment, net Identifiable intangible assets, net Goodwill Deferred income taxes and other assets TOTAL ASSETS LIABILITIES AND SHAREHOLDERS' EQUITY Current liabilities: Current portion of long-term debt Notes payable Accounts payable Accrued liabilities Income taxes payable Total current liabilities Long-term debt Deferred income taxes and other liabilities Commitments and contingencies (Note 15) Redeemable preferred stock Shareholders' equity: Common stock at stated value: Class A convertible 329 and 329 shares outstanding Class B - 1,272 and 1,314 shares outstanding Capital in excess of stated value Accumulated other comprehensive loss Retained earnings Total shareholders' equity TOTAL LIABILITIES AND SHAREHOLDERS' EQUITY 336 2.279 3,269 150 325 2,048 3,011 84 5,474 3,471 1,907 6,040 3,468 3,216 6,384 (92) 3,517 3 5,710 (213) 6,907 12,407 23,259 9,812 - 22,536 $ Year Ended May 31, 2017 2018 2016 1,933 $ 4.240 $ 3,760 747 649 647 218 706 (273) 215 10 (117) (80) 236 27 13 (99) 98 187 60 (255) 35 (426) (231) (120) (158) 3,846 (590) (161) (586) 3,399 1,515 4,955 (4,783) 3,613 2,496 (5,928) 3,623 2,423 (5,367) 2.924 2.386 150 (1,143) 10 (1,028) 3 (In millions) Cash provided by operations: Net income Adjustments to reconcile net income to net cash provided by operations: Depreciation Deferred income taxes Stock-based compensation Amortization and other Net foreign currency adjustments Changes in certain working capital components and other assets and liabilities: Decrease (increase) in accounts receivable (Increase) in inventories Decrease (increase) in prepaid expenses and other current and non-current assets Increase (decrease) in accounts payable, accrued liabilities and other current and non-current liabilities Cash provided by operations Cash provided (used) by investing activities: Purchases of short-term investments Maturities of short-term investments Sales of short-term investments Investments in reverse repurchase agreements Additions to property, plant and equipment Disposals of property, plant and equipment Other investing activities Cash provided (used) by investing activities Cash used by financing activities: Net proceeds from long-term debt issuance Long-term debt payments, including current portion Increase (decrease) in notes payable Payments on capital lease and other financing obligations Proceeds from exercise of stock options and other stock issuances Repurchase of common stock Dividends - common and preferred Tax payments for net share settlement of equity awards Cash used by financing activities Effect of exchange rate changes on cash and equivalents Net increase (decrease) in cash and equivalents Cash and equivalents, beginning of year CASH AND EQUIVALENTS, END OF YEAR Supplemental disclosure of cash flow information: Cash paid during the year for Interest, net of capitalized interest Income taxes Non-cash additions to property, plant and equipment Dividends declared and not paid The accompanying Notes to the Consolidated Financial Statements are an integral part of this statement (1,105) 13 (34) (1,008) 6 (25) 276 (1,034) (6) 1,482 (44) 327 13 (17) 489 (23) 733 (4,254) (1,243) (55) (4,835) 45 (3,223) (1,133) (29) (2,148) (20) 670 981 (106) (67) (7) 507 (3.238) (1,022) (22) (2,974) (105) (714) 3,852 3,138 441 3,138 3,808 4,249 $ $ 3,808 $ 70 125 529 98 703 748 294 266 252 271 320 300 C-8 Appendix C Selected Excerpts from Nike Inc., Form 10-K for the Fiscal Year Ended May 31, 2018 NIKE, Inc. Consolidated Statements of Shareholders' Equity Capital in Excess of Stated Value 4,165 $ 680 Accumulated Other Comprehensive Income 1,246 Retained Earnings Total $ 7,293 $ 12,707 680 (148) (3,090) (3,238) (1,053) (1.053) 105 (11) 94 236 236 3,760 3,760 (928) - $ 318 5,038 525 $ 6,899 (928) 12,258 525 - (189) (3,060) (3,249) Common Stock Class A Class B (In millions, except per share data) Shares Amount Shares Amount Balance at May 31, 2015 355 $ 1,357 $ 3 $ Stock options exercised 22 Conversion to Class B Common Stock 2 Repurchase of Class B Common Stock (55) Dividends on common stock ($0.62 per share) and preferred stock ($0.10 per share) Issuance of shares to employees, net of shares withheld for employee taxes 3 Stock-based compensation Net income Other comprehensive income (loss) Balance at May 31, 2016 353 1,329 $ Stock options exercised 17 Conversion to Class B Common Stock (24) 24 Repurchase of Class B Common Stock (60) Dividends on common stock (S0.70 per share) and preferred stock ($0.10 per share) Issuance of shares to employees, net of shares withheld for employee taxes Stock-based compensation Net income Other comprehensive income (loss) Balance at May 31, 2017 329 1,314 $ 3 $ Stock options exercised 24 Conversion to Class B Common Stock Repurchase of Class B Common Stock (70) Dividends on common stock ($0.78 per share) and preferred stock ($0.10 per share) Issuance of shares to employees, net of shares withheld for employee taxes Stock-based compensation Net Income Other comprehensive income (loss) Reclassifications to retained earnings in accordance with ASU 2018-02 Balance at May 31, 2018 329 $ 1,272 $ $ The accompanying Notes to the Consolidated Financial Statements are an integral part of this statement (1,159) (1,159) 121 215 (13) 108 215 4,240 4,240 (531) 6,907 $ 12,407 600 (531) (213) $ $ 5,710 600 (254) (4,013) (4,267) (1,265) (1,265) 110 (28) 82 218 218 1,933 1,933 104 104 17 (17) 6,384 $ (92) $ 3,517 $ 9,812