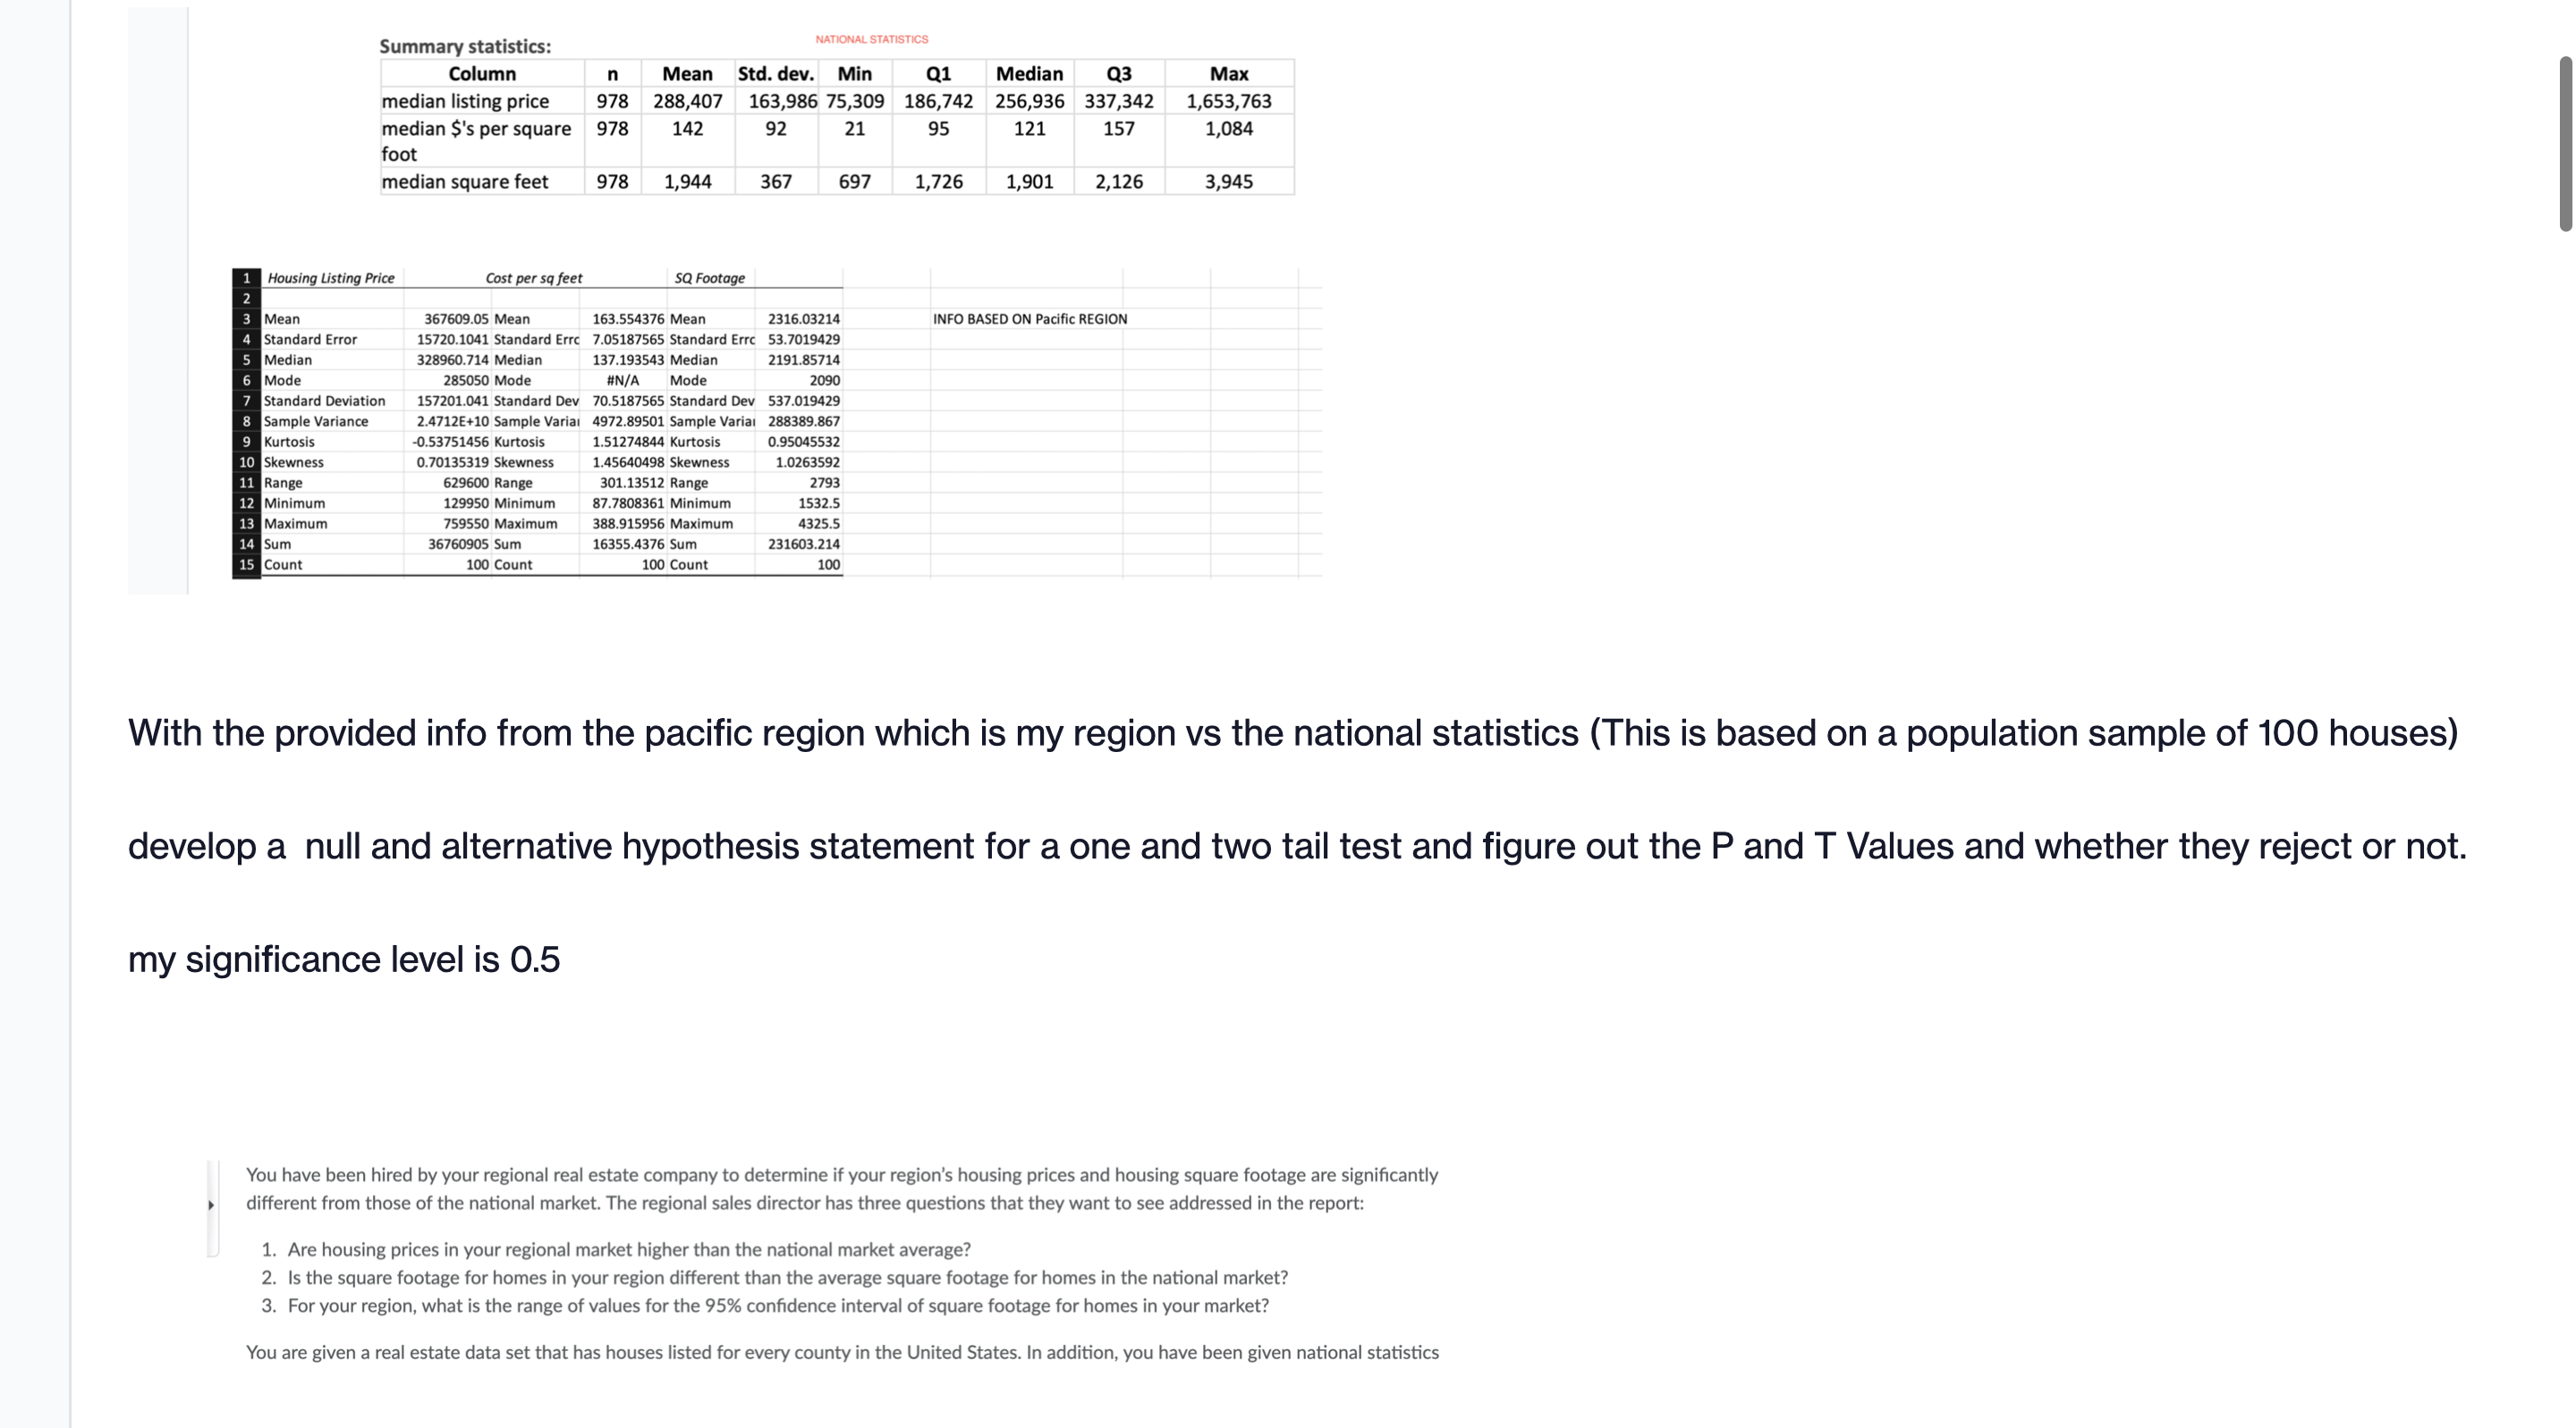
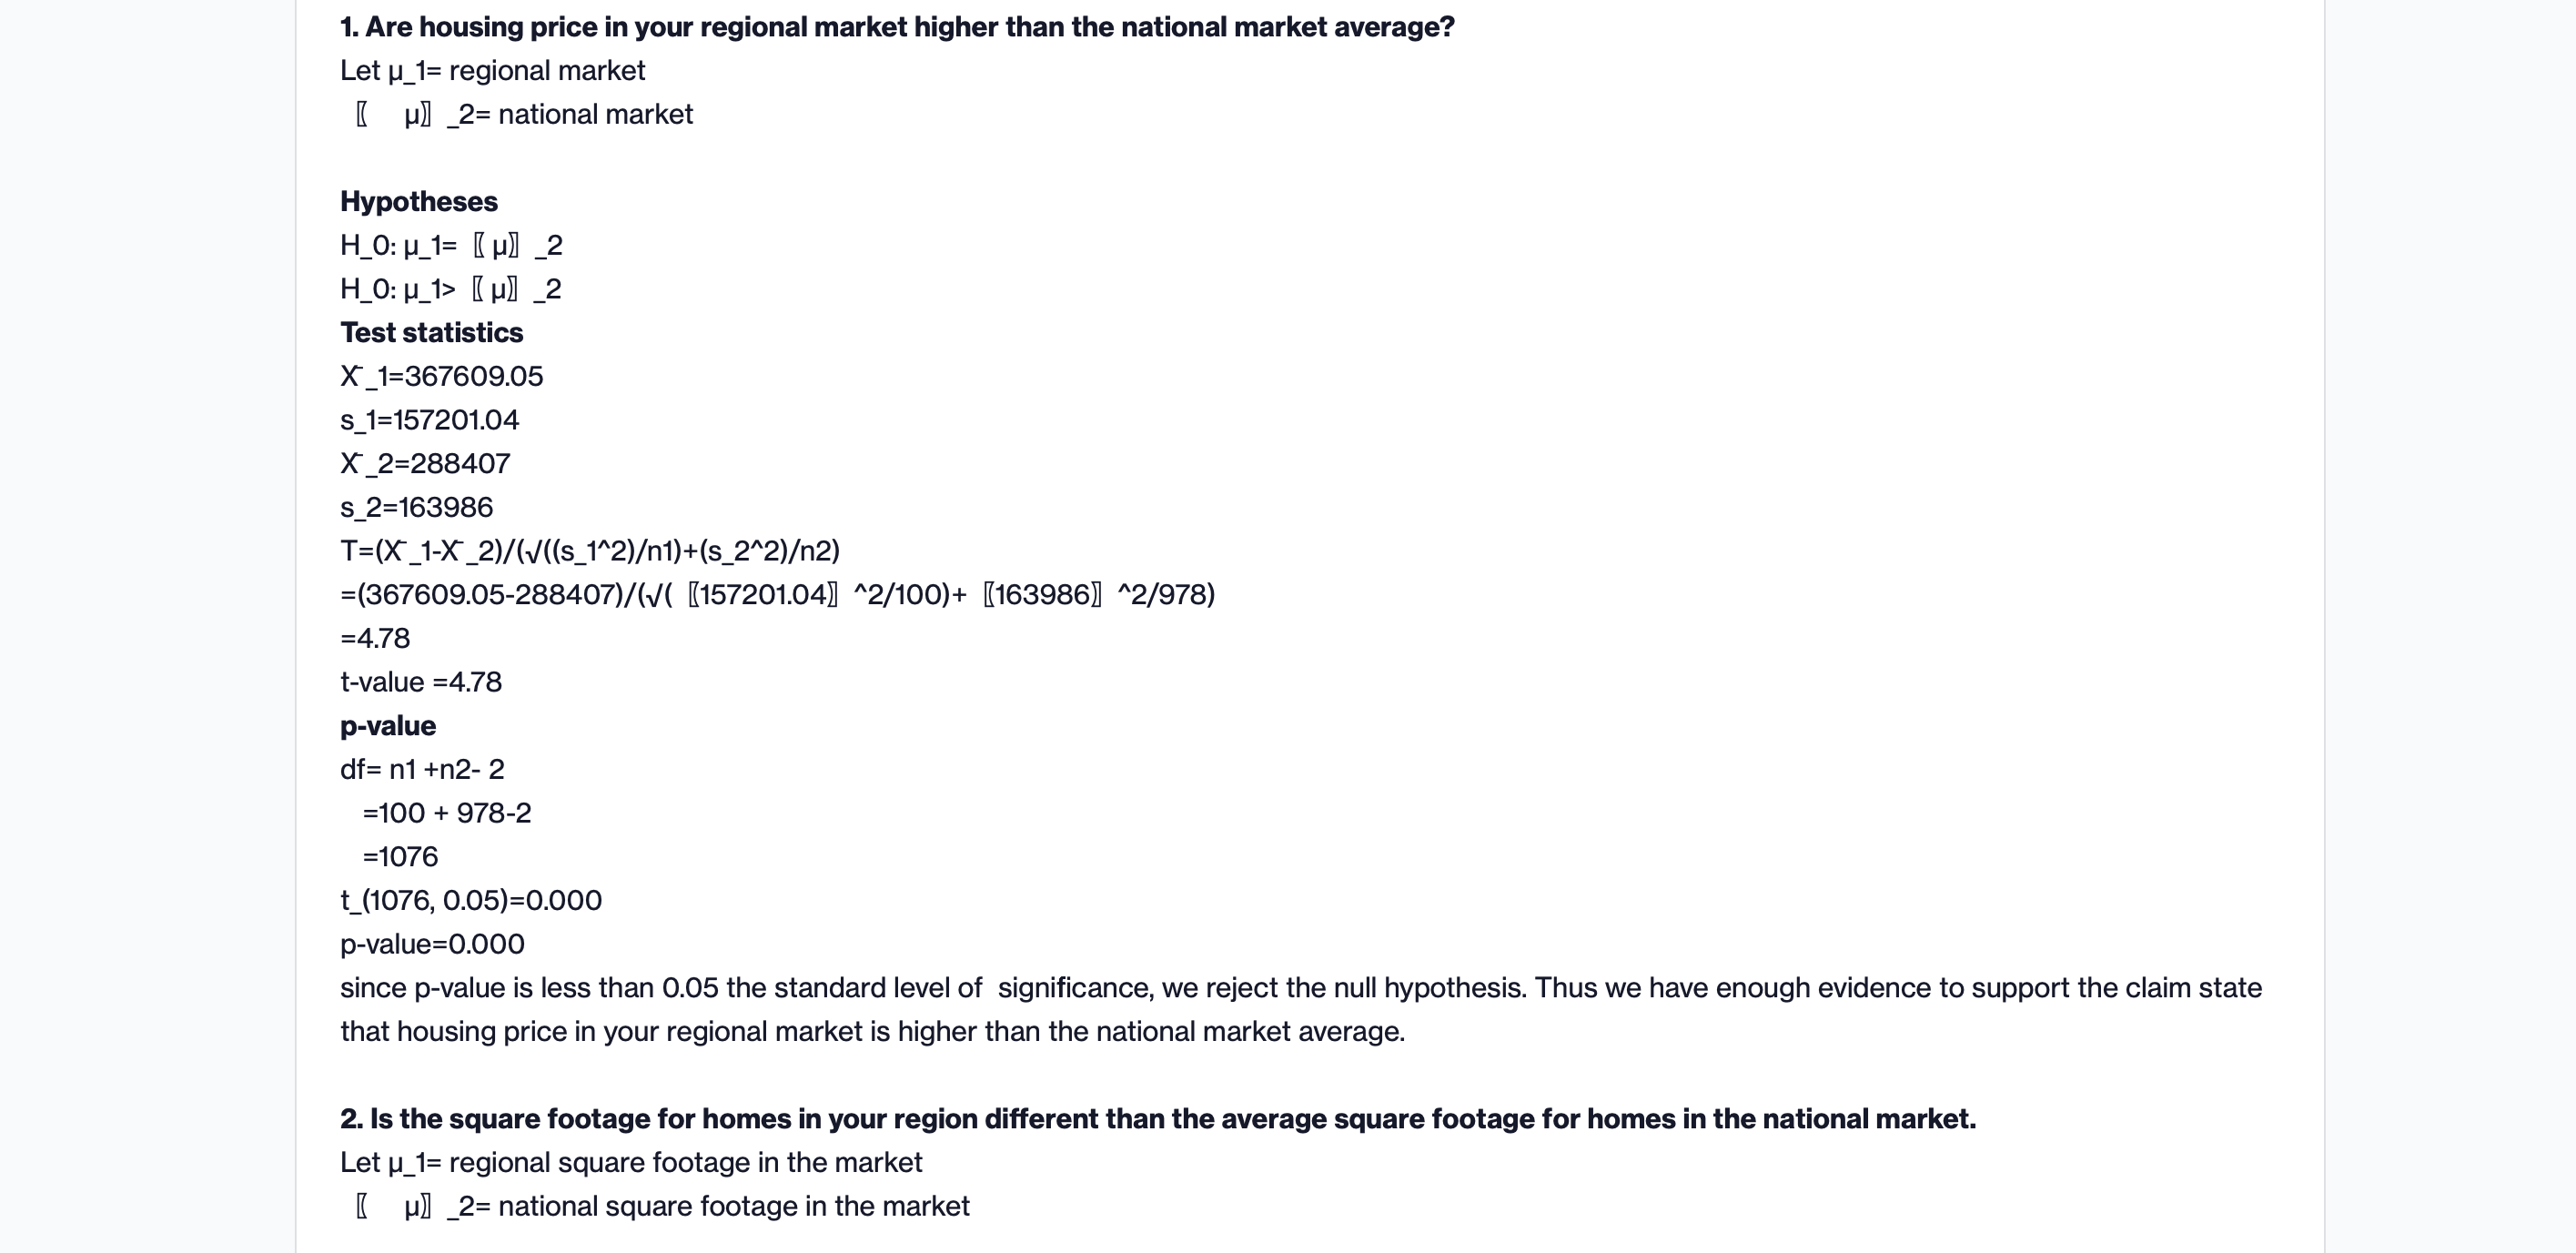
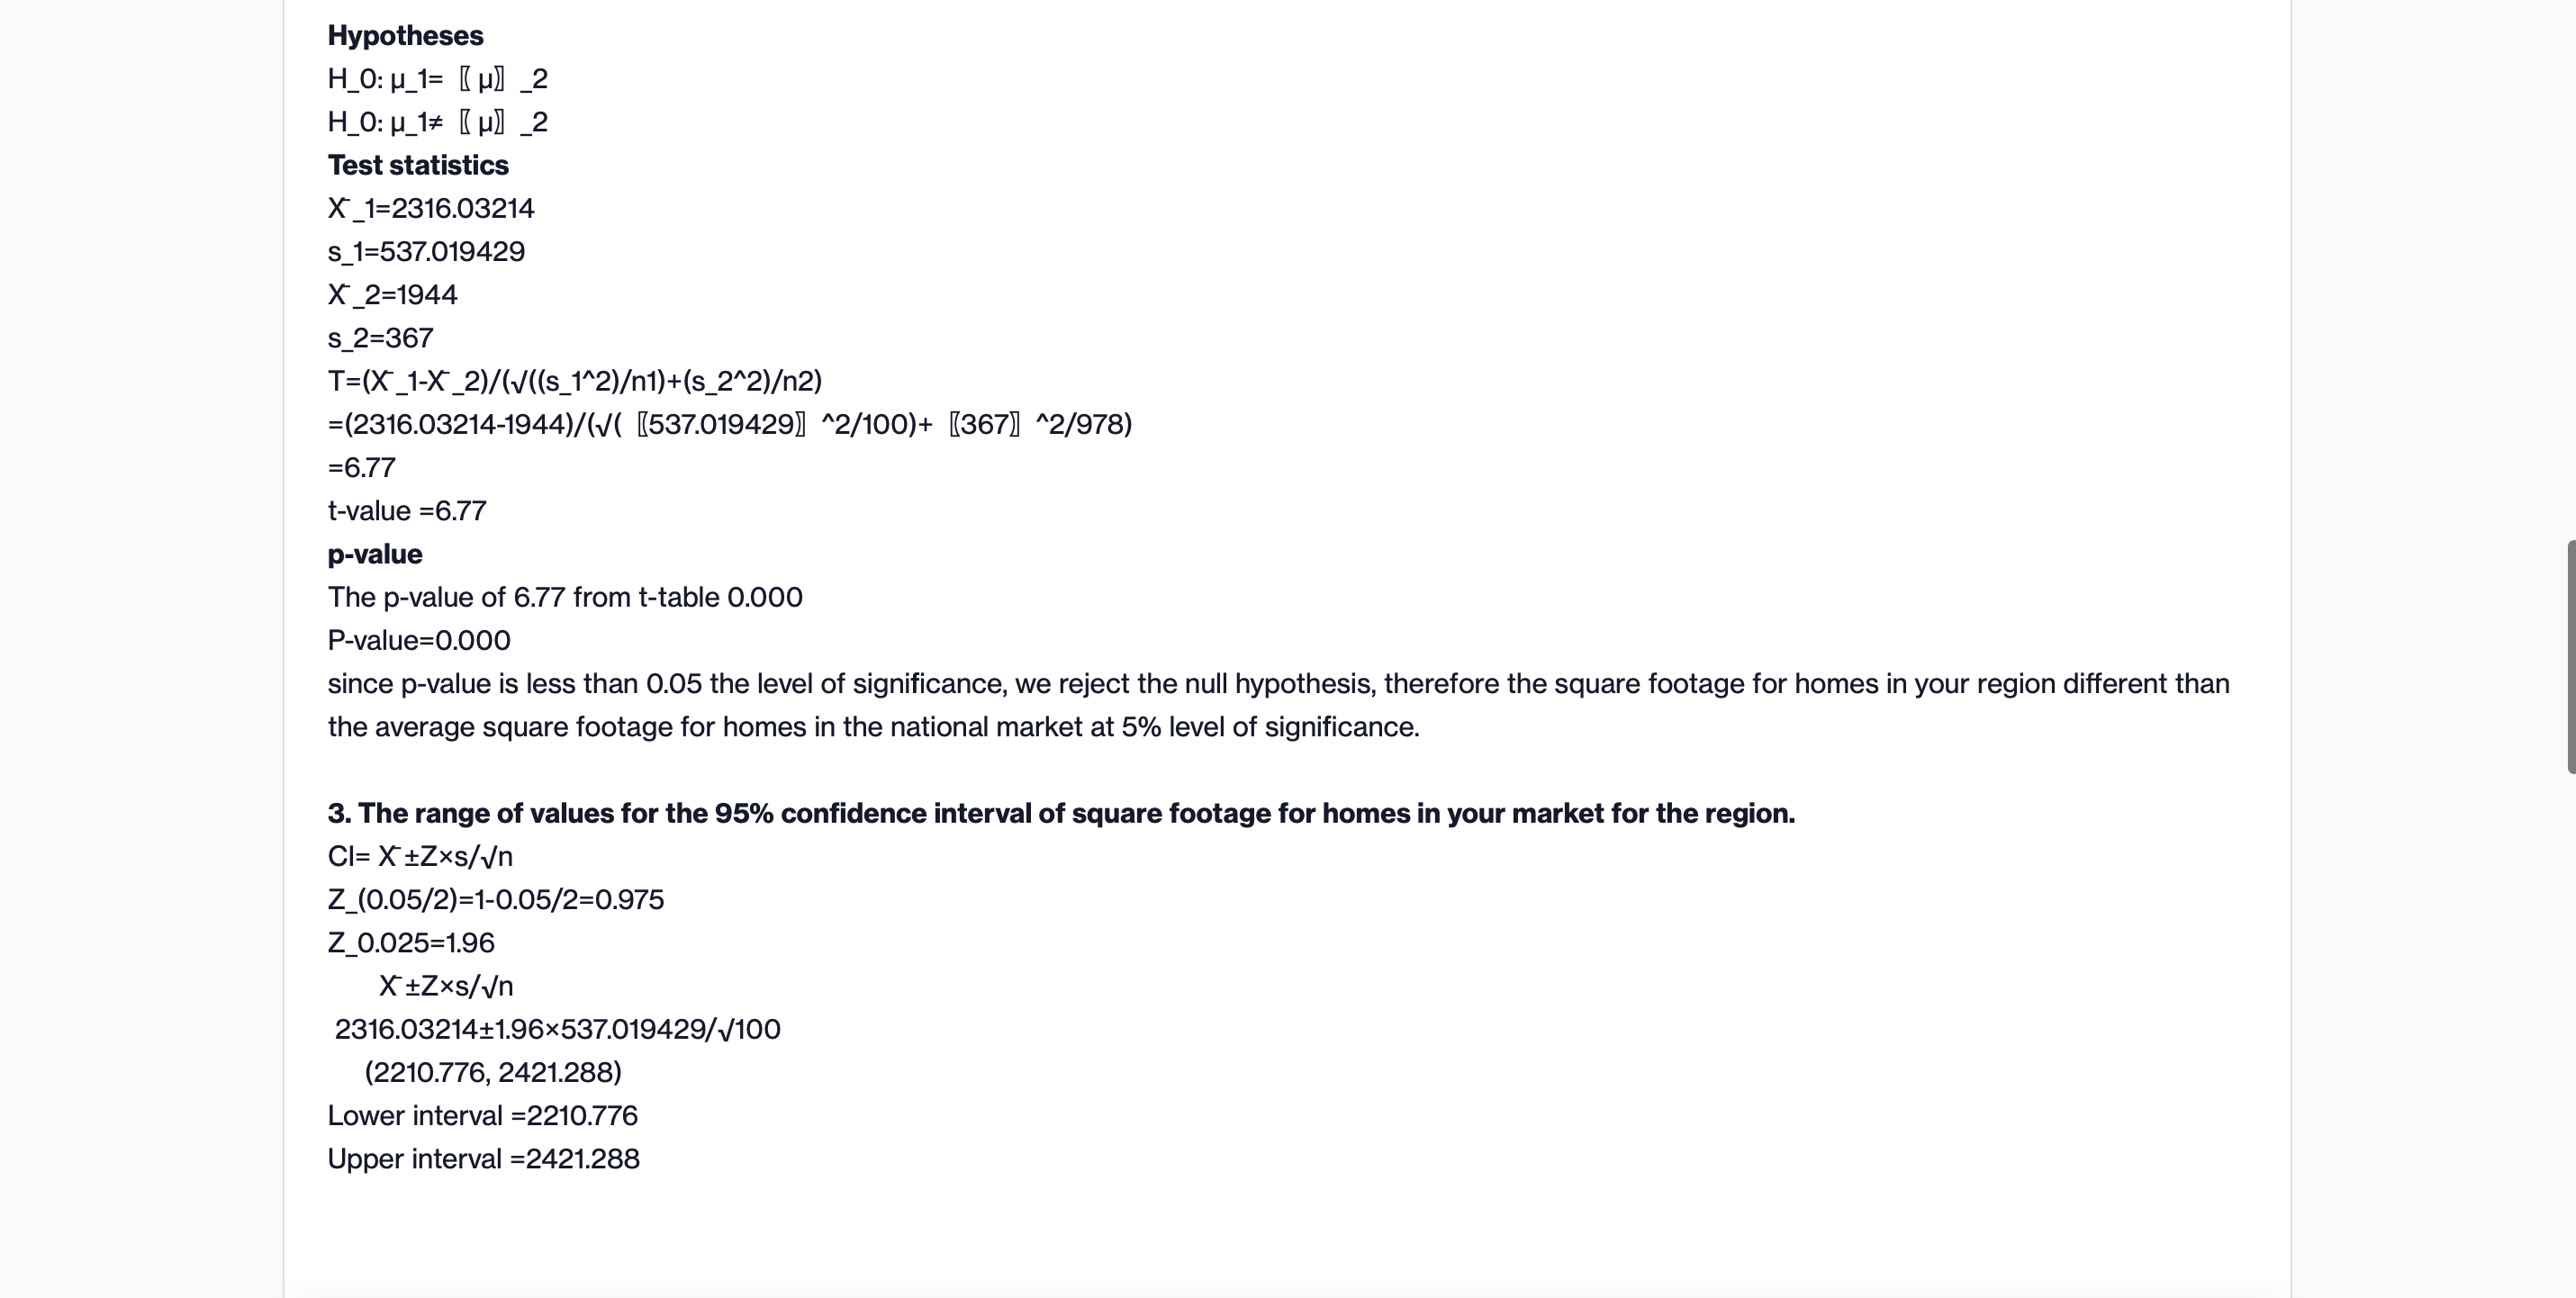
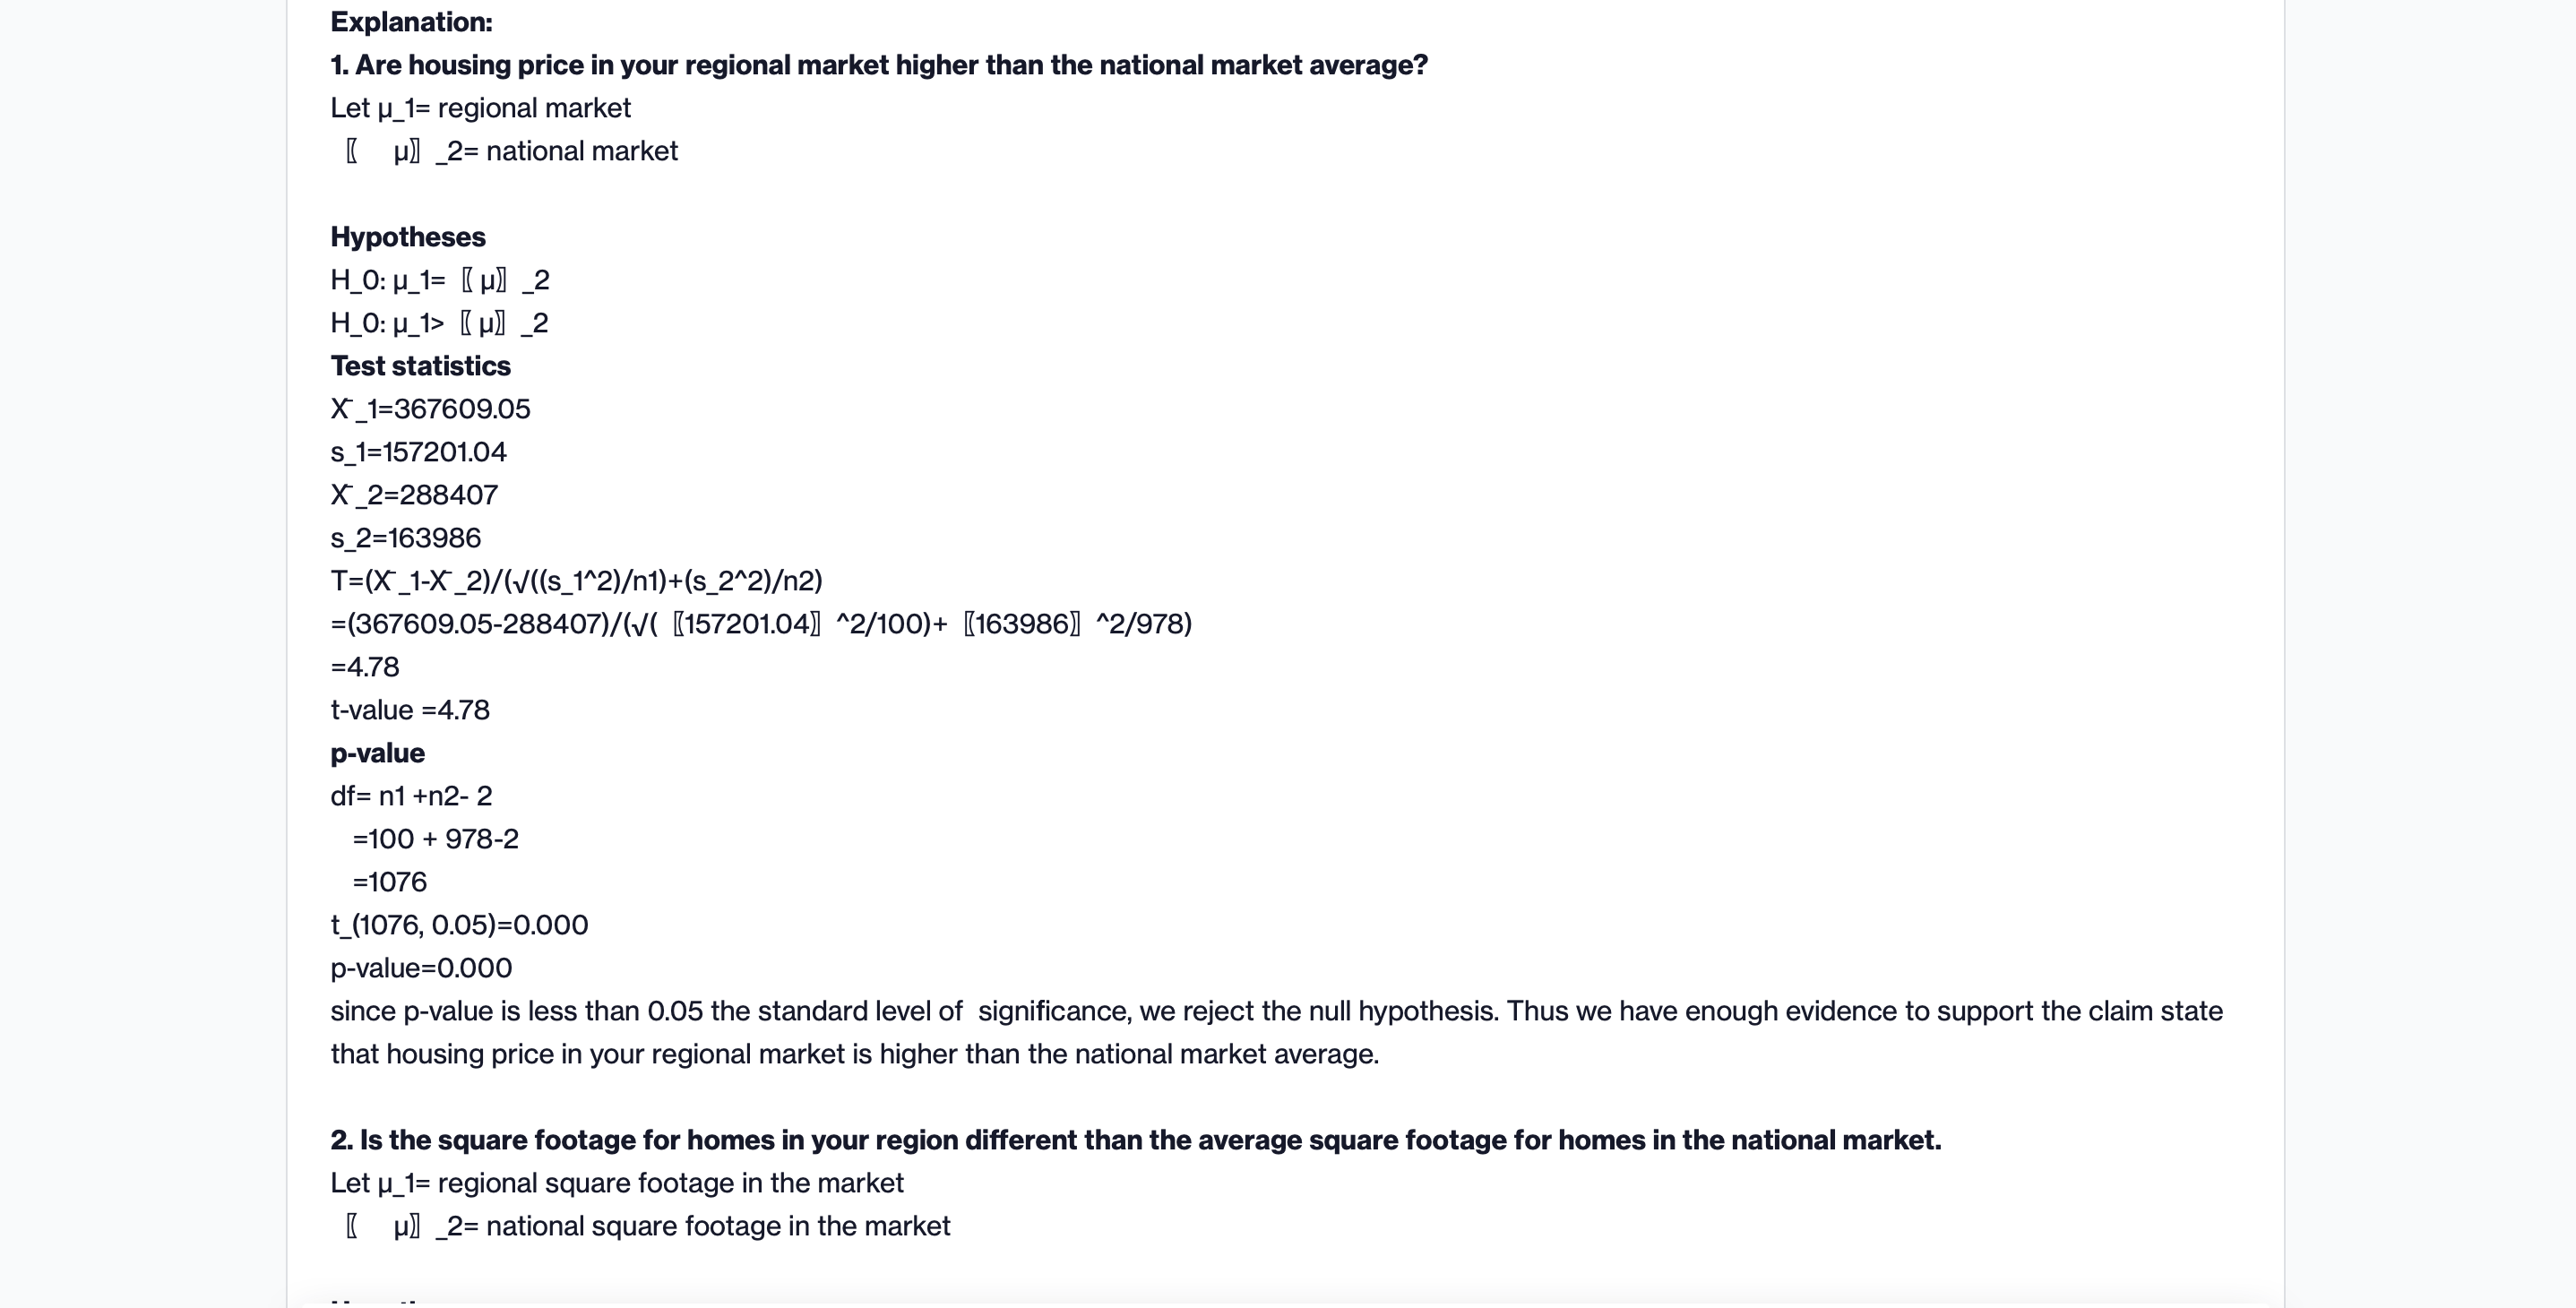
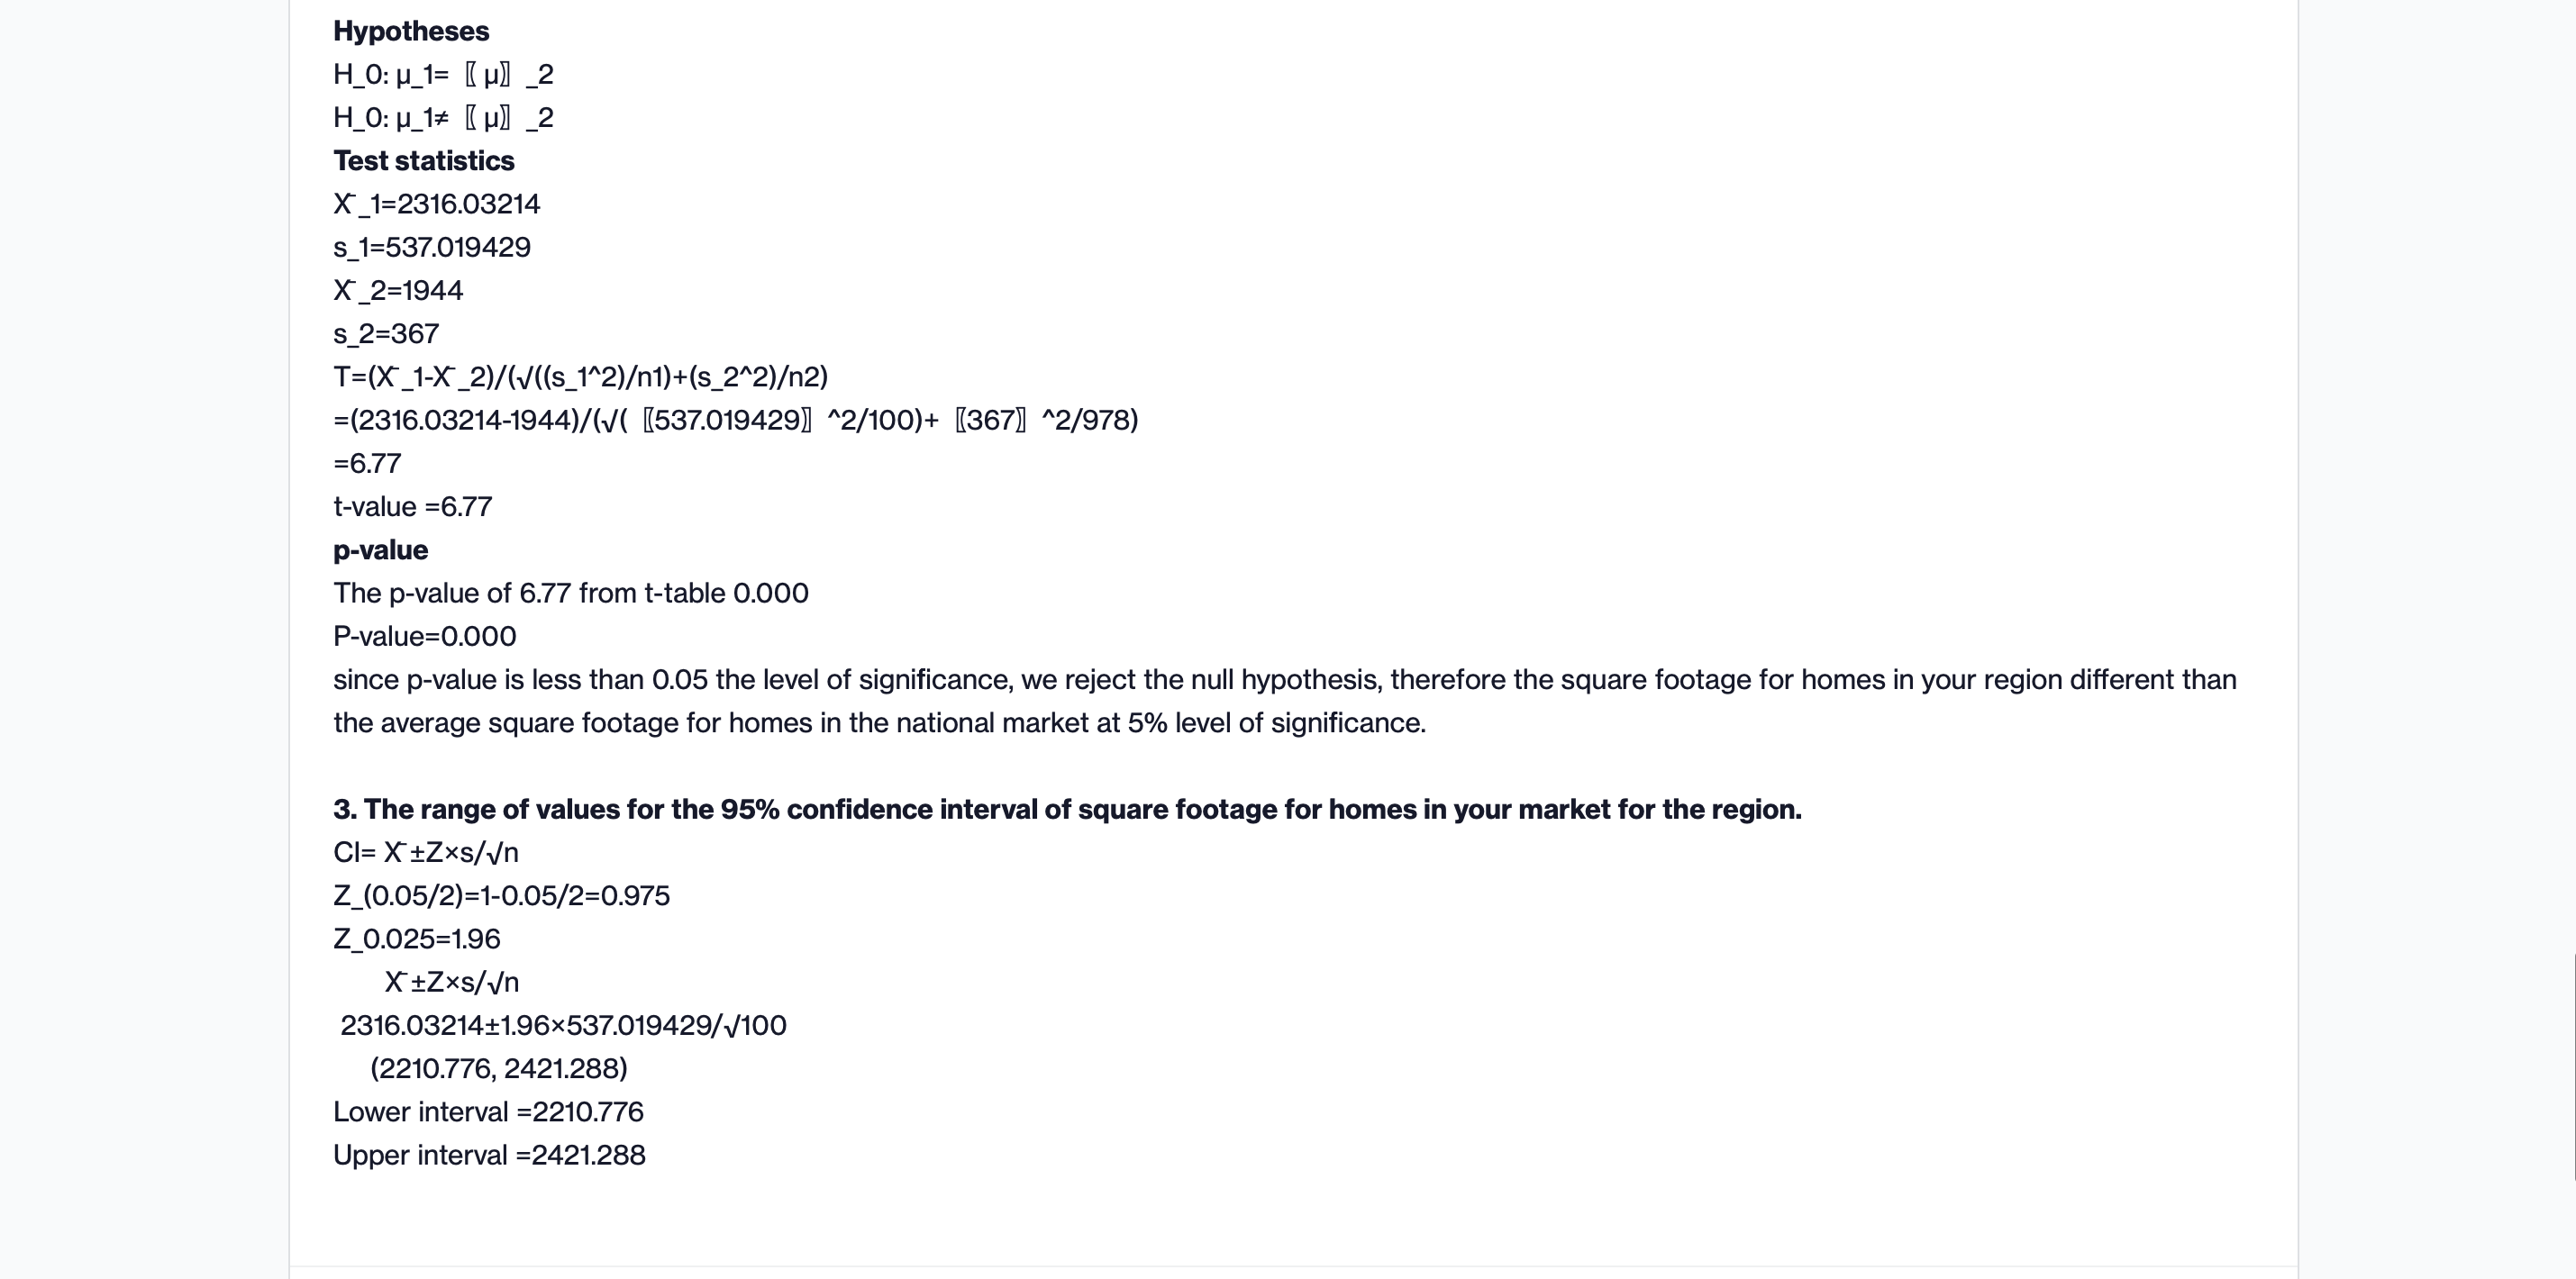
Nnimat surlsrlcs Summary mllstlis: Column ii Mean Std. dew. Mln 01 Median 113 Max median listing price 978 158,407 165,986 75,309 186,741 156,936 337,341 1,653,765 median S's per square 978 142 92 21 as 121 157 1,084 foot median square feel 97! 1,944 367 697 1,726 1,901 1,116 3,945 min: Listing Price magnum so Footage Mean was.\" Mun 161554376 Mun 131503214 info weuou mint mm Slum-Id Emu 1572mm Sundud Em 7.0511756: Stand-id rm 53.7mm Median 3mm Median 137153543 Median 219115714 Mode um Mode IlN/A Mode 2m standard Deviation 15mm: standard oev mamas; standard Dev 5311019429 Simple Varunoe ammo sample Vlrill 4972139501 Sunni: Vll'lll Imam Kunosls 053751.55 mitosis 151114-44 inmost; 095045532 Sir-mm \"Masai: stamina toms: sumo 1.0263592 lingo 529m lam 311113512 Range 27:; Minimum 12m Minimum 17.7mm: Minimum 15:25 Mlxlmum 159550 Maximum 38685956 Minimum 25:; 36760905 Sum \"355.4376 sum 1315031214 mo count 100 count 100 With the provided info from the pacific region which is my region vs the national statistics (This is based on a population sample of 100 houses) develop a null and alternative hypothesis statement for a one and two tail test and figure out the P and T Values and whether they reject or not. my significance level is 0.5 You have been hired by your regional real estate company to determine if your region's housing prices and housing square footage are significantly . different from those of the national market The regional sales director has three questions that they want to see addressed in the report: 1. Are housing prices in your regional market higher than the national market average? 2. is the square footage for homes in your region different than the average square footage for homes in the national market? 3. For your region. what is the range of values for the 95% condence interval of square footage for homes in your market? You are given a real estate data set that has houses listed for every county in the United States. In addition. you have been given national statistics 1. Are housing price in your regional market higher than the national market average? Let u_1= regional market K uII _2= national market Hypotheses H_0: u_1= II pl] _2 H_0: u_1> IIpII _2 Test statistics )(_1=367609.05 s_1=157201.04 X'_2=288407 s_2=163986 T=(X'_1-X_2)/(\\/((S_1"2)1)+(s_2"2)2) =(367609.05-288407)/(J( K157201043 \"2/100)+ K1639862| "2/978) =4.78 t-value =4.78 p-value df= n1 +n2 2 =100 + 978-2 =1076 t_(1076, 0.05)=0.000 p-value=0.000 since pvalue is less than 0.05 the standard level of significance, we reject the null hypothesis. Thus we have enough evidence to support the claim state that housing price in your regional market is higher than the national market average. 2. Is the square footage for homes in your region different than the average square footage for homes in the national market. Let u_1= regional square footage in the market K LID _2= national square footage in the market Hypotheses H_0: H_1= [ H) _2 H_O: _1= [ M) _2 Test statistics X_1=2316.03214 S_1=537.019429 X_2=1944 s_2=367 T=(X_1-X_2)/(V((s_1^2)1)+(s_2^2)2) =(2316.03214-1944)/(v( [537.019429] ^2/100)+ [367] ^2/978) =6.77 t-value =6.77 p-value The p-value of 6.77 from t-table 0.000 P-value=0.000 since p-value is less than 0.05 the level of significance, we reject the null hypothesis, therefore the square footage for homes in your region different than the average square footage for homes in the national market at 5% level of significance. 3. The range of values for the 95% confidence interval of square footage for homes in your market for the region. CI= X +Zxs/Vn Z_(0.05/2)=1-0.05/2=0.975 Z_0.025=1.96 X +Zxs/Vn 2316.03214+1.96x537.019429/V100 (2210.776, 2421.288) Lower interval =2210.776 Upper interval =2421.288Explanation: 1. Are housing price in your regional market higher than the national market average? Let u_1= regional market II 11)] _2= national market Hypotheses H_O: u_1= II uII _2 H_O: u_1> Hull _2 Test statisties X\"_1=367609.05 s_1=157201.04 X\"_2=288407 s_2=163986 T=(X'_1X\"_2)/(\\/((S_1"2)1)+(s_2"2)2) =(367609.05-288407)/(\\/( K157201.04)] A2/100)+ K1639861| \"2/978) =4.78 t-value =4.78 p-value df= n1 +n2 2 =100 + 978-2 =1076 t_(1076, 0.05)=0.000 p-value=0.000 since pvalue is less than 0.05 the standard level of significance, we reject the null hypothesis. Thus we have enough evidence to support the claim state that housing price in your regional market is higher than the national market average. 2. Is the square footage for homes in your region different than the average square footage for homes in the national market. Let u_1= regional square footage in the market II uII _2= national square footage in the market Hypotheses H_O: M_1= [ H) _2 H_O: _1* [ p) _2 Test statistics X_1=2316.03214 S_1=537.019429 X_2=1944 s_2=367 T=(X_1-X_2)/(V((s_1^2)1)+(s_2^2)2) =(2316.03214-1944)/(v( [537.019429] ^2/100)+ [367] ^2/978) =6.77 t-value =6.77 p-value The p-value of 6.77 from t-table 0.000 P-value=0.000 since p-value is less than 0.05 the level of significance, we reject the null hypothesis, therefore the square footage for homes in your region different than the average square footage for homes in the national market at 5% level of significance. 3. The range of values for the 95% confidence interval of square footage for homes in your market for the region. CI= X +Zxs/Vn Z_(0.05/2)=1-0.05/2=0.975 Z_0.025=1.96 X+Zxs/Vn 2316.03214+1.96x537.019429/V100 (2210.776, 2421.288) Lower interval =2210.776 Upper interval =2421.288