

Answered step by step
Verified Expert Solution
Question
1 Approved Answer
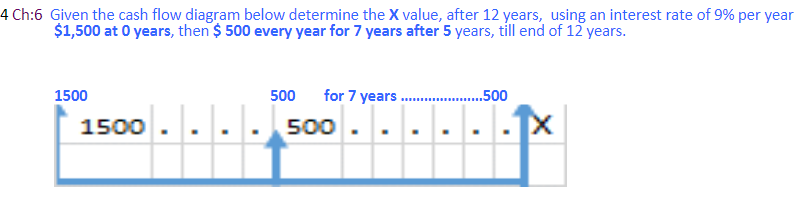
No excel 4 Ch:6 Given the cash flow diagram below determine the X value, after 12 years, using an interest rate of 9% per year
No excel
4 Ch:6 Given the cash flow diagram below determine the X value, after 12 years, using an interest rate of 9% per year $1,500 at 0 years, then $ 500 every year for 7 years after 5 years, till end of 12 years. 1500 500 for 7 years ... ..500 1500. ... 500. XStep by Step Solution
There are 3 Steps involved in it
Step: 1

Get Instant Access to Expert-Tailored Solutions
See step-by-step solutions with expert insights and AI powered tools for academic success
Step: 2

Step: 3
Ace Your Homework with AI
Get the answers you need in no time with our AI-driven, step-by-step assistance
Get Started
The Handbook Of Financial Modeling
Authors: Jack Avon
1st Edition
1430262052, 978-1430262053