Answered step by step
Verified Expert Solution
Question
1 Approved Answer
no more data Solve the following questions showing full details. Tables are provided for you in case you need them. Q2. A quality engineer working

no more data
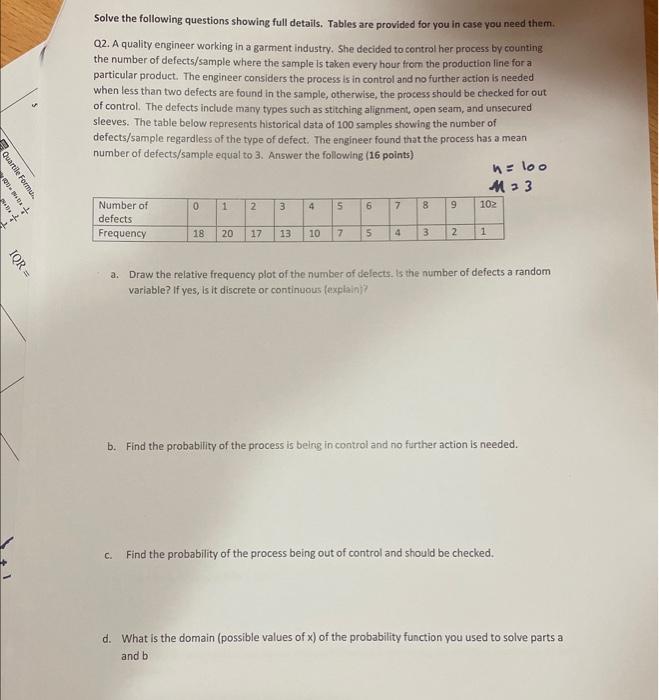
Solve the following questions showing full details. Tables are provided for you in case you need them. Q2. A quality engineer working in a garment industry. She decided to control her process by counting the number of defects/sample where the sample is taken every hour from the production line for a particular product. The engineer considers the process is in control and no further action is needed when less than two defects are found in the sample, otherwise, the process should be checked for out of control. The defects include many types such as stitching alignment, open seam, and unsecured sleeves. The table below represents historical data of 100 samples showing the number of defects/sample regardless of the type of defect. The engineer found that the process has a mean number of defects/sample equal to 3. Answer the following ( 16 points) n=100M=3 a. Draw the relative frequency plot of the number of delects, is the number of defects a random variable? If yes, is it discrete or continuous fexphinj? b. Find the probability of the process is being in control and no furthar action is needed. c. Find the probability of the process being out of control and should be checked. d. What is the domain (possible values of x ) of the probability function you used to solve parts a and b Step by Step Solution
There are 3 Steps involved in it
Step: 1

Get Instant Access to Expert-Tailored Solutions
See step-by-step solutions with expert insights and AI powered tools for academic success
Step: 2

Step: 3

Ace Your Homework with AI
Get the answers you need in no time with our AI-driven, step-by-step assistance
Get Started


