Answered step by step
Verified Expert Solution
Question
1 Approved Answer
no more information is needed to solve this. Demand for wainut fudge ice cream at the Sweet Cream Dairy can be approximated by a normal


no more information is needed to solve this.
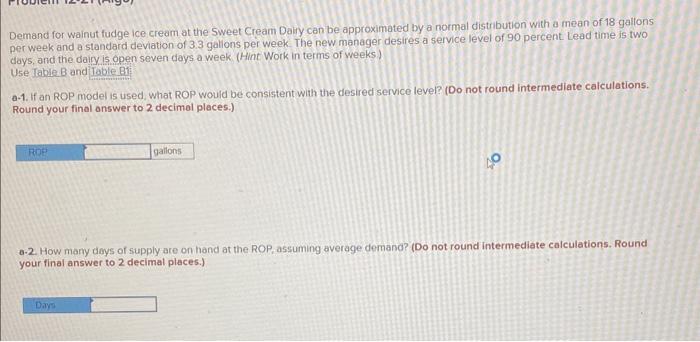
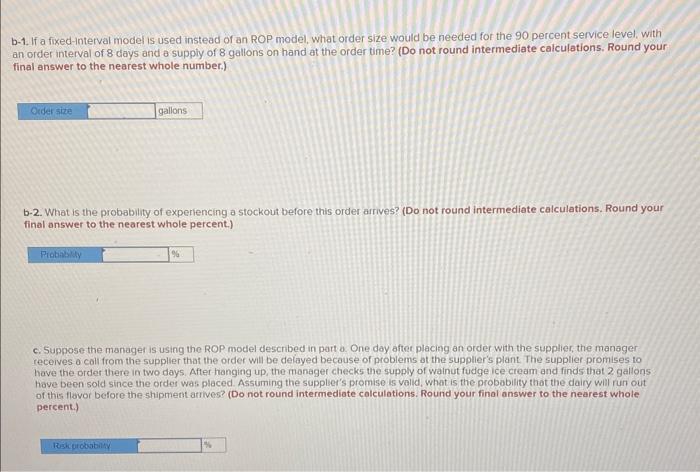
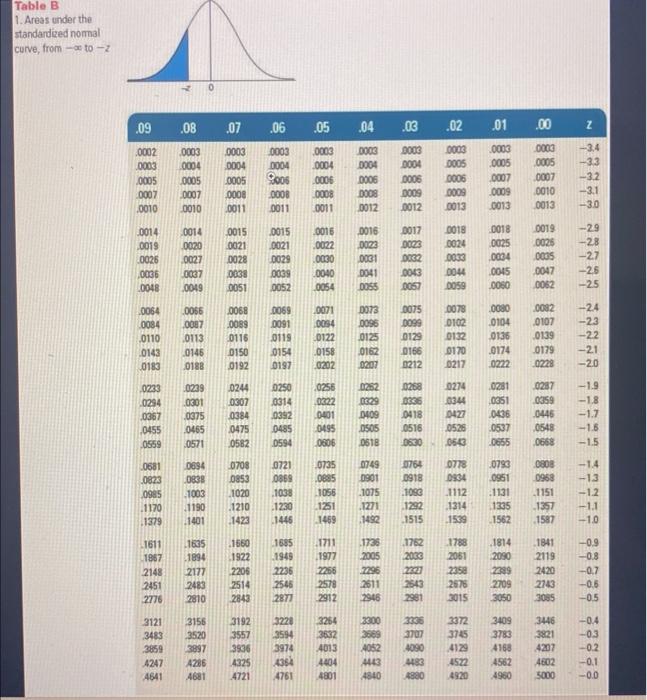
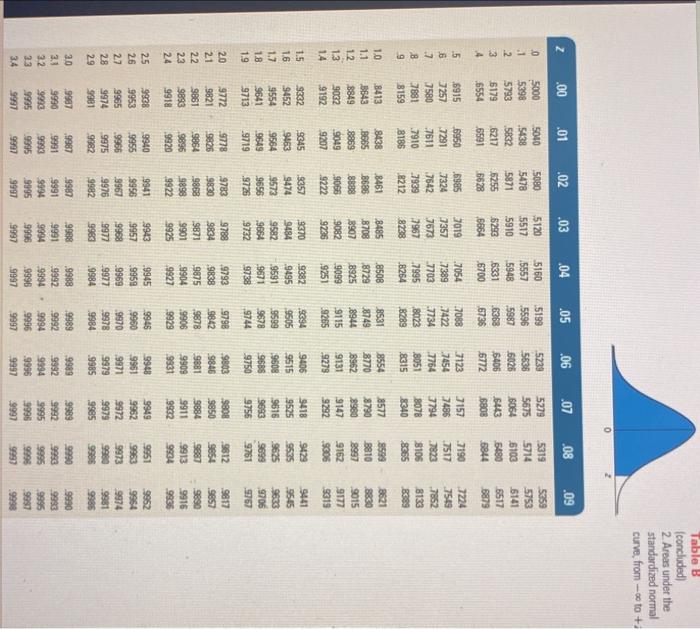
Demand for wainut fudge ice cream at the Sweet Cream Dairy can be approximated by a normal distribution with a mean of 18 gallons per week and a standard deviation of 3.3 gallons per week. The new manager desires a service level of 90 percent Lead time is two days, and the dairv is oben seven days a week (Hint Work in terms of weeks) Use Jable B and a-1. If an ROP model is used, what ROP would be consistent with the desired service level? (Do not round intermediate calculations. Round your final onswer to 2 decimal places.) 0.2. How many doys of supply are on hand at the ROP, assuming average dernana? (Do not round intermediate calculations. Round your final answer to 2 decimal places.) b-1. If a fixed-interval model is used instead of an ROP model, what order size would be needed for the 90 percent service level, with an order interval of 8 days and a supply of 8 gallons on hand at the order time? (Do not round intermediate calculations. Round your final answer to the nearest whole number.) b-2. What is the probability of experiencing a stockout before this order arrives? (Do not round intermediate calculations. Round your final answer to the nearest whole percent.) c. Suppose the manager is using the ROP model described in part a. One day ofter placing an order with the supplier, the manager receives a call from the supplier that the order will be delayed becouse of problems ot the supplier's plant The supplier promises to have the order there in two days. After hanging up, the manager checks the supply of walnut fudge ice cream and finds that 2 gallons have been sold since the order was placed. Assuming the supplier's promise is valid, what is the probability that the dairy wili run out of this flovor before the shipment amives? (Do not round intermediate calculations. Round your final answer to the nearest whole percent.) Table B 1. Areas under the standandized nommal curve, from to -2 Table B (concluded) 2. Areas under the standardized normal curve, from to +Step by Step Solution
There are 3 Steps involved in it
Step: 1

Get Instant Access to Expert-Tailored Solutions
See step-by-step solutions with expert insights and AI powered tools for academic success
Step: 2

Step: 3

Ace Your Homework with AI
Get the answers you need in no time with our AI-driven, step-by-step assistance
Get Started


