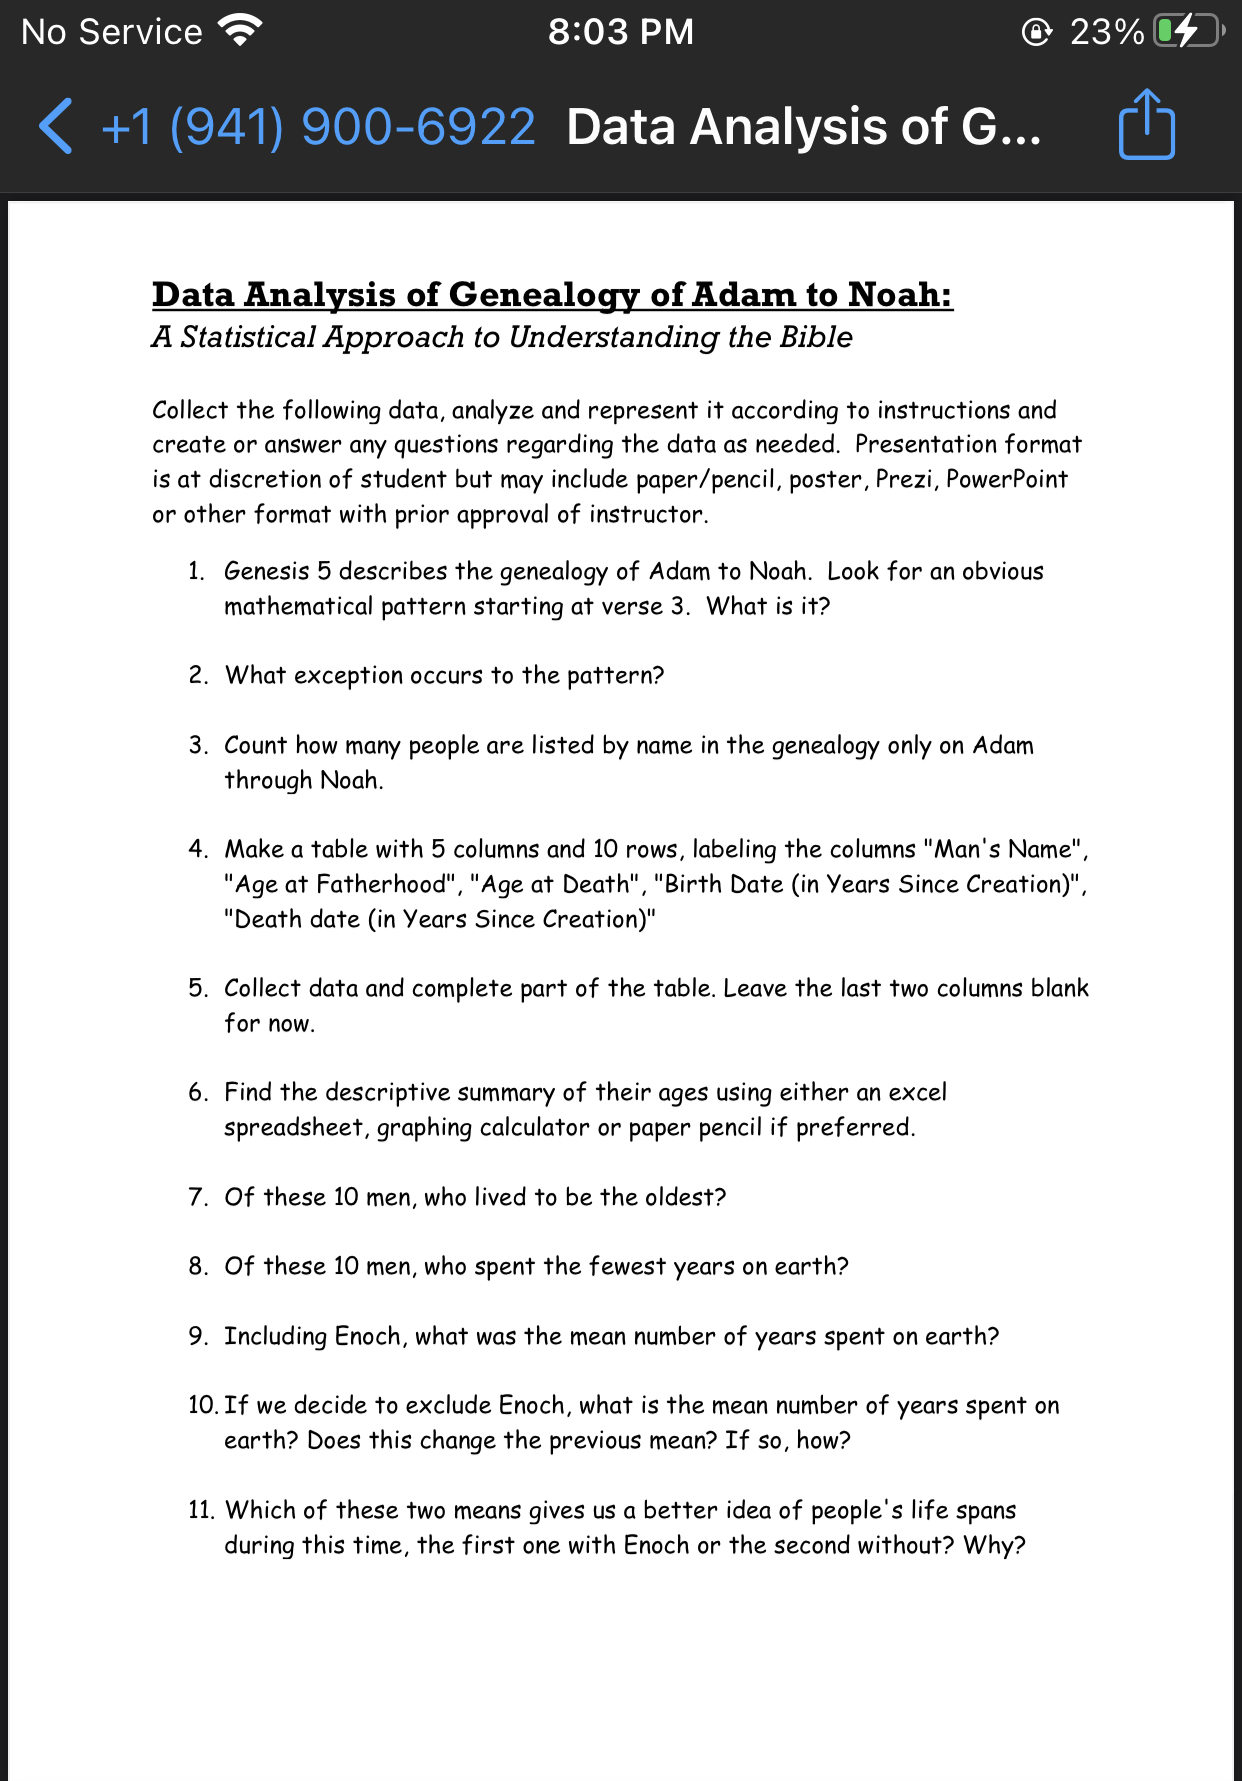
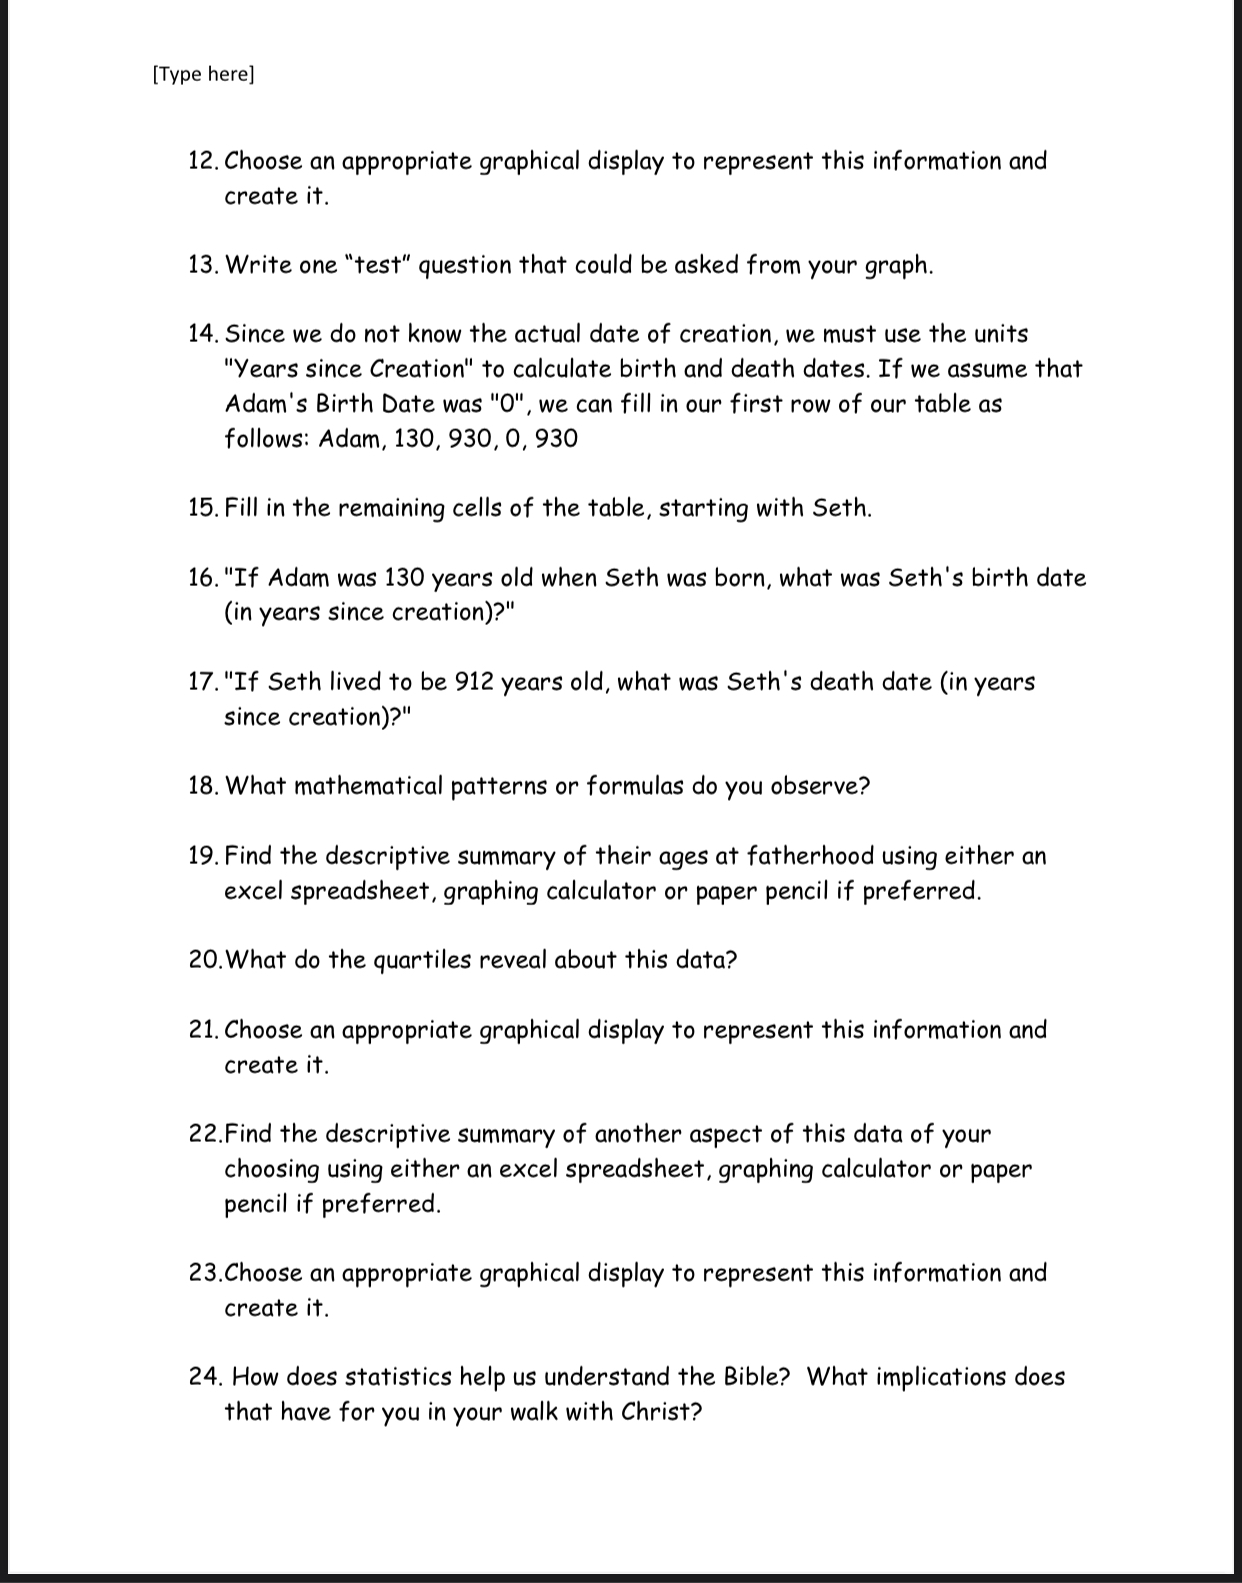
No Service '3 8203 PM @ 23% Data Analysis of G... Data Analysis of Genealogy of Adam to Noah: A Statistical Approach to Understanding the Bible Collect the following data, analyze and represent it according to instructions and create or answer any questions regarding the data as needed. Presentation format is at discretion of student but may include paper/ penci l, poster, Prezi, PowerPoint or other format with prior approval of instructor. 1. Genesis 5 describes the genealogy of Adam to Noah. Look for an obvious mathematical pattern starting at verse 3. What is it? 2. What exception occurs to the pattern? 3. Count how many people are listed by name in the genealogy only on Adam through Noah. 4. Make a table with 5 columns and 10 rows, labeling the columns "Man's Name", "Age at Fatherhood", "Age at Death", "Birth Date (in Years Since Creation)", "Death date (in Years Since Creation)" 5. Collect data and complete part of the table. Leave the last two columns blank for now. 6. Find the descriptive summary of their ages using either an excel spreadsheet, graphing calculator or paper pencil if preferred. 7. Of theSe 10 men, who lived to be the oldest? 3. Of theSe 10 men, who spent the fewest years on earth? 9. Including Enoch, what was the mean number of years spent on earth? 10. If we decide to exclude Enoch, what is the mean number of years spent on earth? Does this change the previous mean? If so, how? 11. Which of theSe two means gives us a better idea of people's life spans during this time, the first one with Enoch or the second without? Why? [Type here] 12. Choose an appropriate graphical display to represent this information and create it. 13. Write one \"test" question that could be asked from your graph. 14. Since we do not know the actual date of creation, we must use the units "Years since Creation" to calculate birth and death dates. If we assume that Adam's Birth Date was "0", we can fill in our first row of our table as follows: Adam, 130. 930, 0. 930 15. Fill in the remaining cells of the table, starting with Seth. 16. "If Adam was 130 years old when Seth was born, what was Seth's birth date (in years since creation)?" 17. "If Seth lived to be 912 years old, what was Seth's death date (in years since creation)?" 18. What mathematical patterns or formulas do you observe? 19. Find the descriptive summary of their ages at fatherhood using either an excel spreadsheet, graphing calculator or paper pencil if preferred. 20.What do the quartiles reveal about this data? 21. Choose an appropriate graphical display to represent this information and create it. 22.Find the descriptive summary of another aspect of this data of your choosing using either an excel spreadsheet. graphing calculator or paper pencil if preferred. 23.Choose an appropriate graphical display to represent this information and create it. 24. How does statistics help us understand the Bible? What implications does that have for you in your walk with Christ


