Answered step by step
Verified Expert Solution
Question
1 Approved Answer
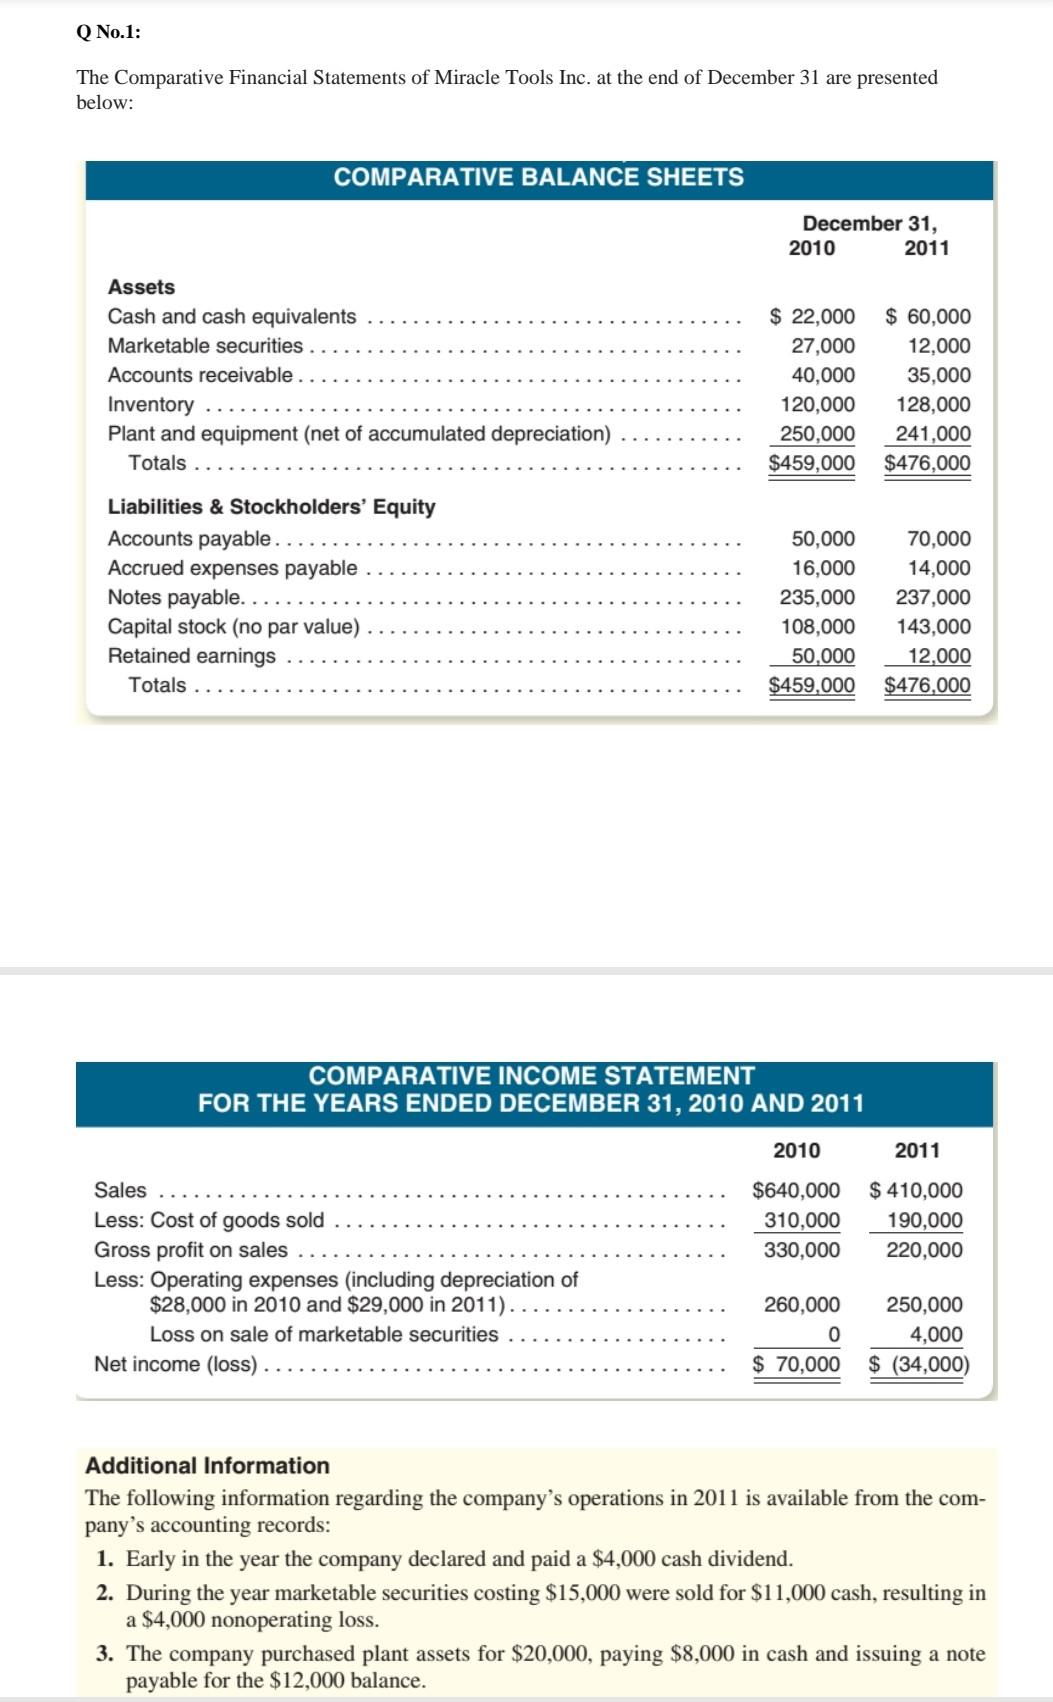
No.1: The Comparative Financial Statements of Miracle Tools Inc. at the end of December 31 are presented below: COMPARATIVE BALANCE SHEETS December 31, 2010 2011


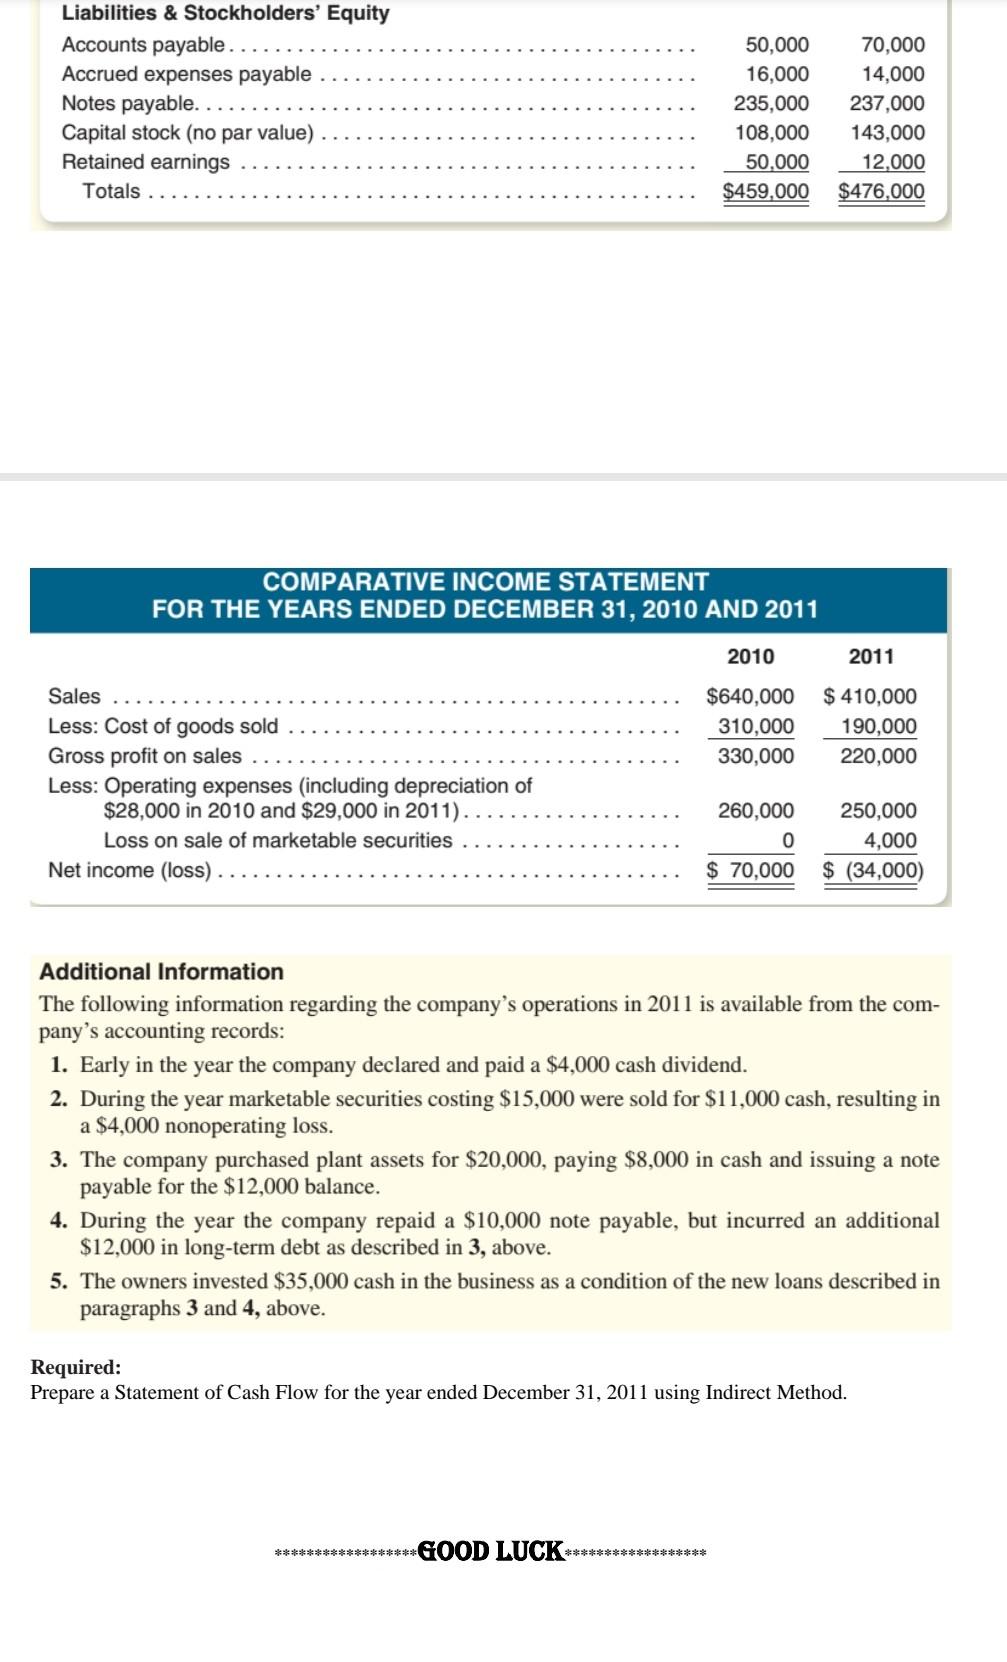
No.1: The Comparative Financial Statements of Miracle Tools Inc. at the end of December 31 are presented below: COMPARATIVE BALANCE SHEETS December 31, 2010 2011 Assets Cash and cash equivalents Marketable securities. Accounts receivable. Inventory Plant and equipment (net of accumulated depreciation) Totals $ 22,000 27,000 40,000 120,000 250,000 $459,000 $ 60,000 12,000 35,000 128,000 241,000 $476,000 Liabilities & Stockholders' Equity Accounts payable Accrued expenses payable Notes payable... Capital stock (no par value) Retained earnings Totals 50,000 16,000 235,000 108,000 50,000 $459.000 70,000 14,000 237,000 143,000 12,000 $476,000 COMPARATIVE INCOME STATEMENT FOR THE YEARS ENDED DECEMBER 31, 2010 AND 2011 2010 2011 $640,000 310,000 330,000 $ 410,000 190,000 220,000 Sales Less: Cost of goods sold Gross profit on sales Less: Operating expenses (including depreciation of $28,000 in 2010 and $29,000 in 2011). Loss on sale of marketable securities Net income (loss). 260,000 0 $ 70,000 250,000 4,000 $ (34,000) Additional Information The following information regarding the company's operations in 2011 is available from the com- pany's accounting records: 1. Early in the year the company declared and paid a $4,000 cash dividend. 2. During the year marketable securities costing $15,000 were sold for $11,000 cash, resulting in a $4,000 nonoperating loss. 3. The company purchased plant assets for $20,000, paying $8,000 in cash and issuing a note payable for the $12,000 balance. Liabilities & Stockholders' Equity Accounts payable. Accrued expenses payable Notes payable... Capital stock (no par value) Retained earnings Totals. 50,000 16,000 235,000 108,000 50.000 $459,000 70,000 14,000 237,000 143,000 12.000 $476,000 COMPARATIVE INCOME STATEMENT FOR THE YEARS ENDED DECEMBER 31, 2010 AND 2011 2010 2011 $640,000 310,000 330,000 $ 410,000 190,000 220,000 Sales Less: Cost of goods sold Gross profit on sales Less: Operating expenses (including depreciation of $28,000 in 2010 and $29,000 in 2011). Loss on sale of marketable securities Net income (loss). 260,000 0 $ 70,000 250,000 4,000 $ (34,000) Additional Information The following information regarding the company's operations in 2011 is available from the com- pany's accounting records: 1. Early in the year the company declared and paid a $4,000 cash dividend. 2. During the year marketable securities costing $15,000 were sold for $11,000 cash, resulting in a $4,000 nonoperating loss. 3. The company purchased plant assets for $20,000, paying $8,000 in cash and issuing a note payable for the $12,000 balance. 4. During the year the company repaid a $10,000 note payable, but incurred an additional $12,000 in long-term debt as described in 3, above. 5. The owners invested $35,000 cash in the business as a condition of the new loans described in paragraphs 3 and 4, above. Required: Prepare a Statement of Cash Flow for the year ended December 31, 2011 using Indirect Method. ******************GOOD LUCK ******************
Step by Step Solution
There are 3 Steps involved in it
Step: 1

Get Instant Access to Expert-Tailored Solutions
See step-by-step solutions with expert insights and AI powered tools for academic success
Step: 2

Step: 3

Ace Your Homework with AI
Get the answers you need in no time with our AI-driven, step-by-step assistance
Get Started


