

Answered step by step
Verified Expert Solution
Question
1 Approved Answer
nomics (1) h Question 3 of 7 This quiz: 100 point(s) possible This question: 20 point(s) possible 2 Use Excel to estimate the linear
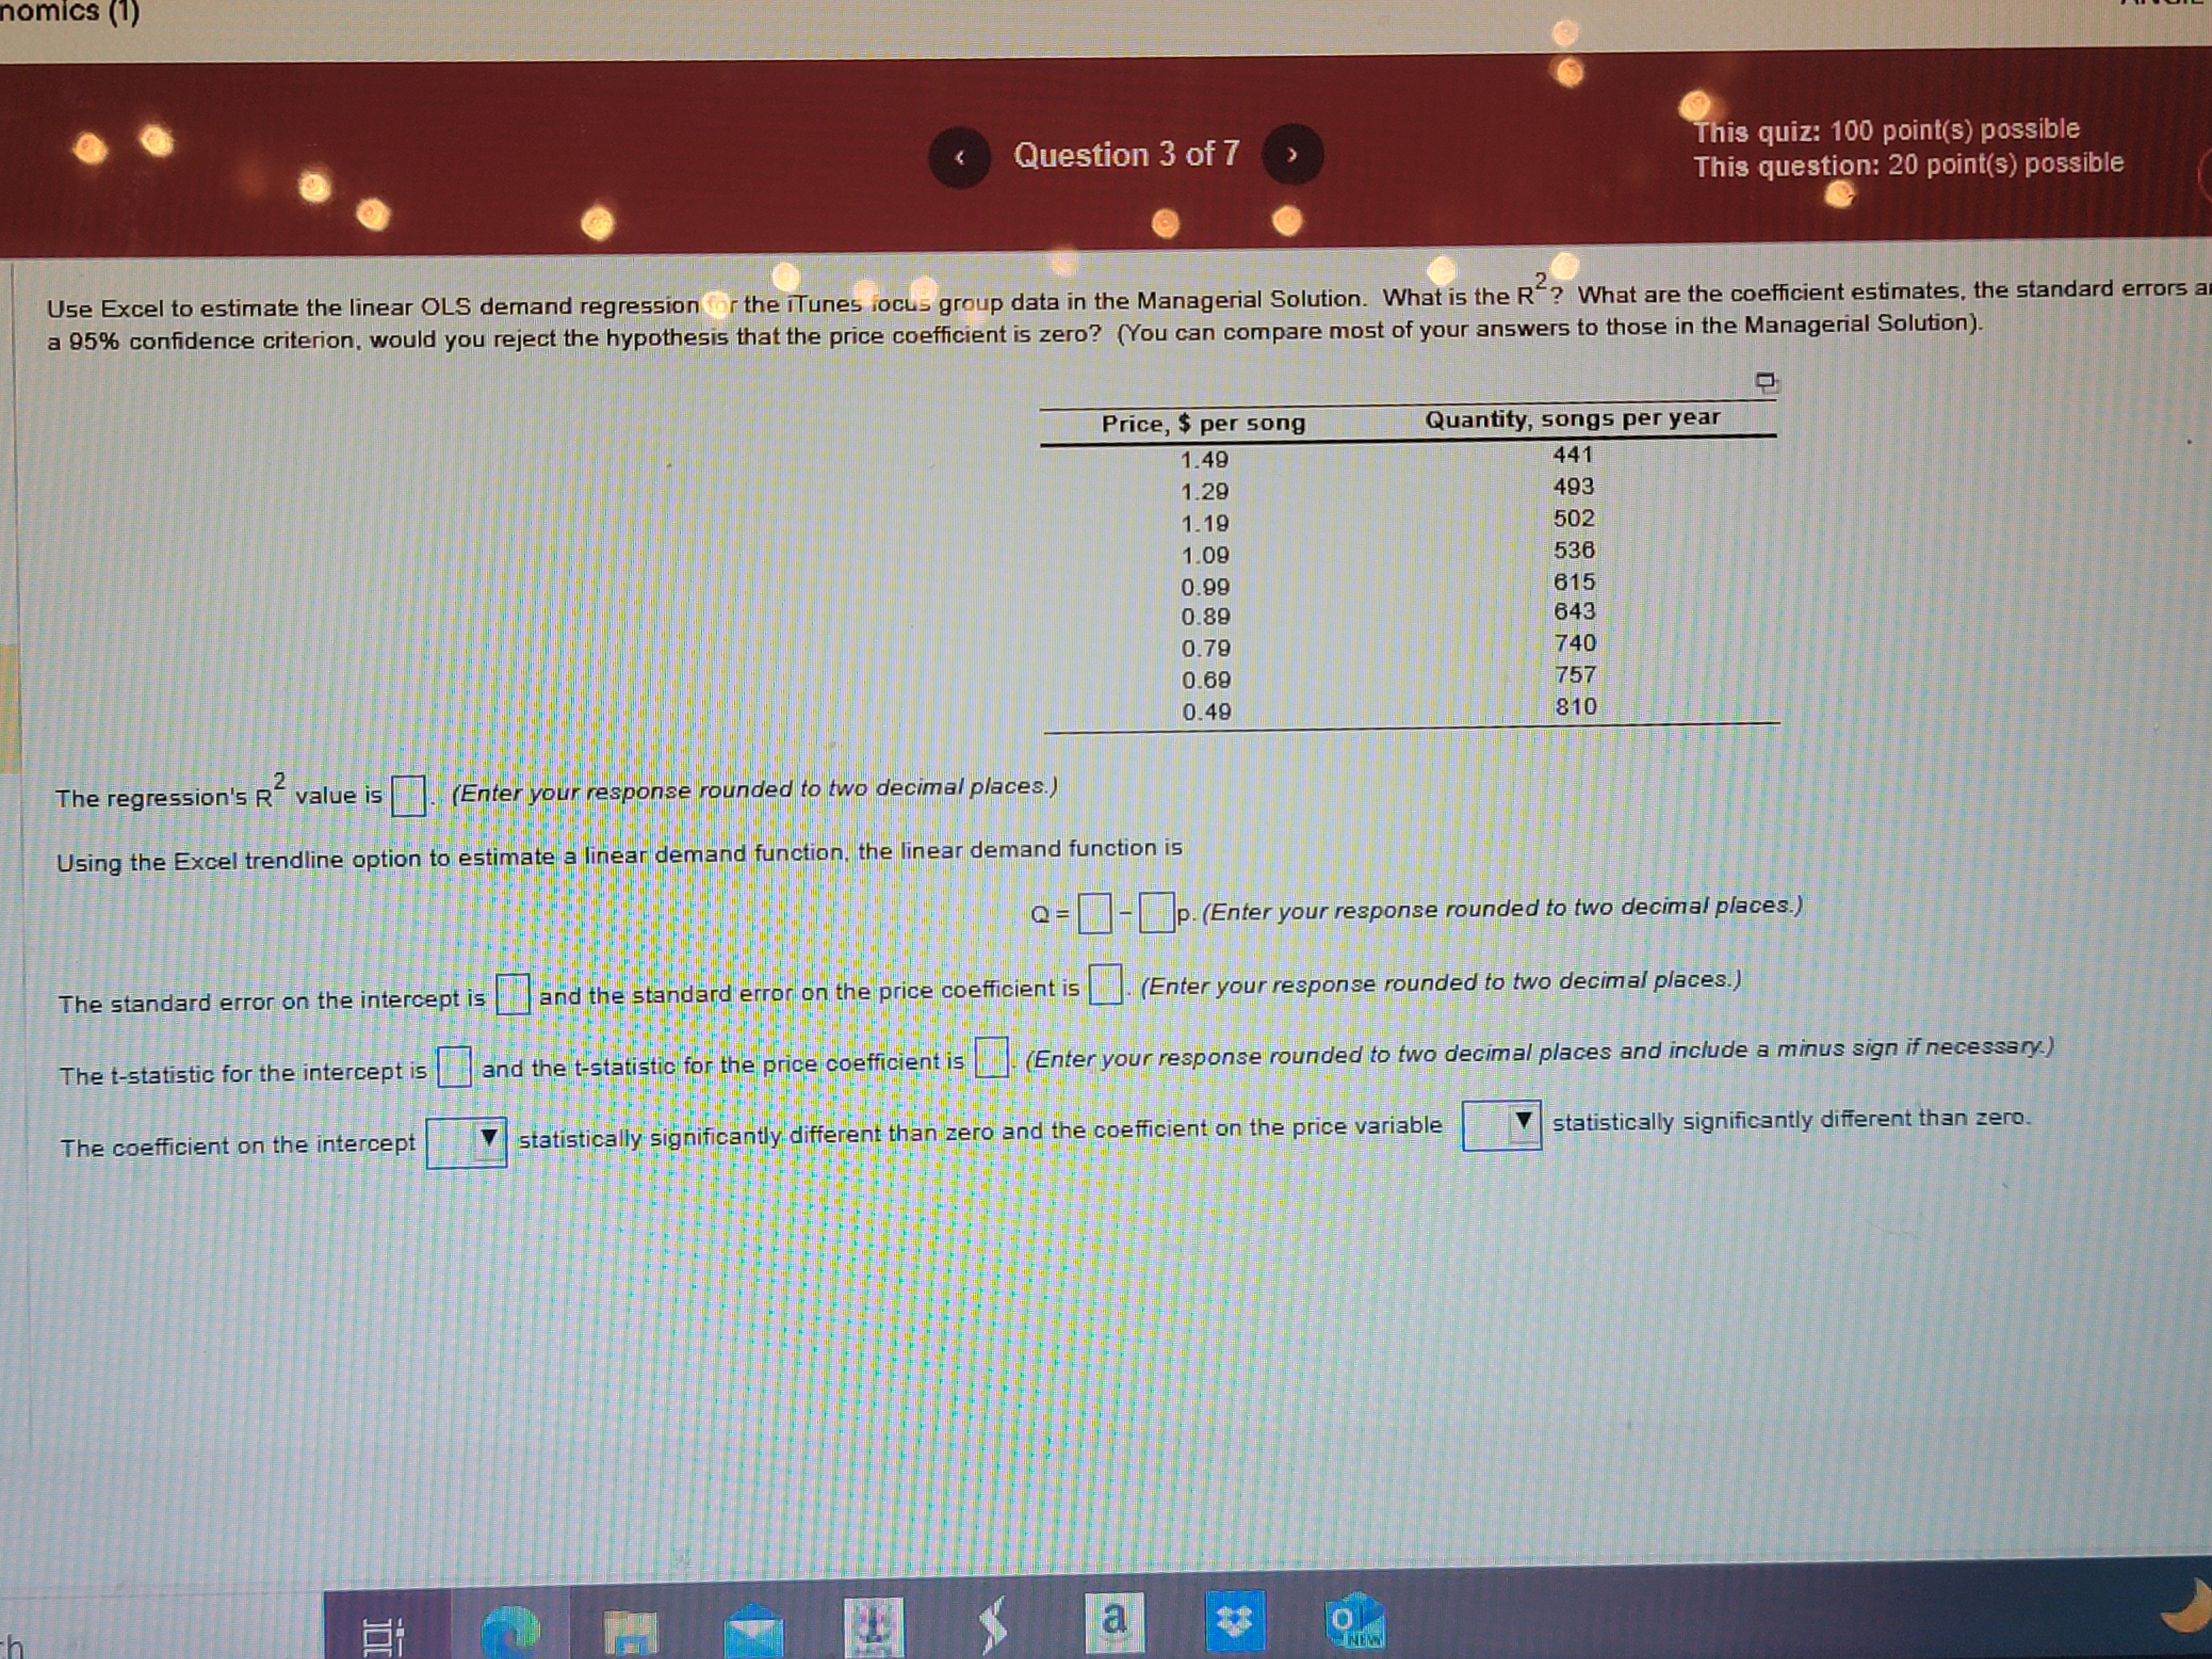
nomics (1) h Question 3 of 7 This quiz: 100 point(s) possible This question: 20 point(s) possible 2 Use Excel to estimate the linear OLS demand regression or the iTunes focus group data in the Managerial Solution. What is the R? What are the coefficient estimates, the standard errors an a 95% confidence criterion, would you reject the hypothesis that the price coefficient is zero? (You can compare most of your answers to those in the Managerial Solution). The regression's R value is 2 (Enter your response rounded to two decimal places.) Price, $ per song Quantity, songs per year 1.49 441 1.29 493 1.19 502 1.09 536 0.99 615 0.89 643 0.79 740 0.69 757 0.49 810 Using the Excel trendline option to estimate a linear demand function, the linear demand function is The standard error on the intercept is The t-statistic for the intercept is The coefficient on the intercept = - p. (Enter your response rounded to two decimal places.) and the standard error on the price coefficient is (Enter your response rounded to two decimal places.) and the t-statistic for the price coefficient is (Enter your response rounded to two decimal places and include a minus sign if necessary.) statistically significantly different than zero and the coefficient on the price variable statistically significantly different than zero.
Step by Step Solution
There are 3 Steps involved in it
Step: 1

Get Instant Access to Expert-Tailored Solutions
See step-by-step solutions with expert insights and AI powered tools for academic success
Step: 2

Step: 3
Ace Your Homework with AI
Get the answers you need in no time with our AI-driven, step-by-step assistance
Get Started
Managerial Economics and Strategy
Authors: Jeffrey M. Perloff, James A. Brander
1st edition
978-0137036059, 133379094, 321566440, 137036051, 9780133379099, 978-0321566447